
Figures & data
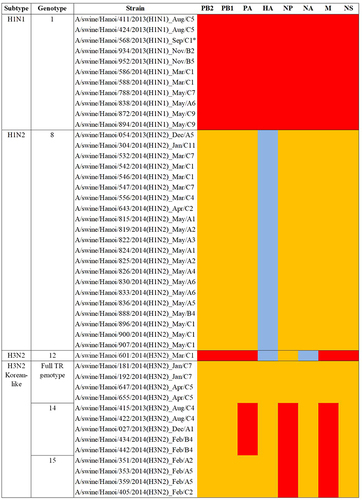
Genotype numbers were defined by Takemae et al.Citation28 Lineages: red: H1N1 Pandemic 2009; yellow: Triple-reassortant; blue: human-like
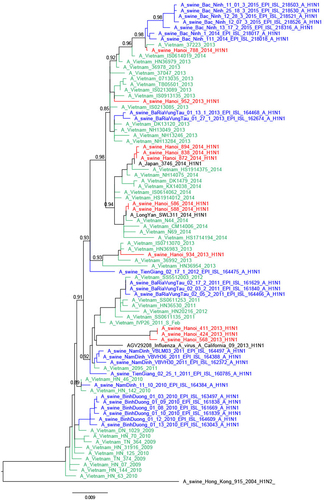
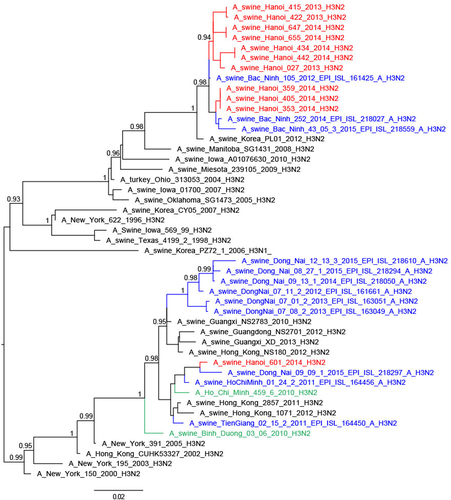
The trees were constructed with PhyML. Branch support aLRT statistics were shown at major nodes with values larger or equal to 0.8. GenBank accession numbers of retrieved sequences are indicated. Red: sequences from our study; blue: sequences from Takemae et al.Citation28; green: viruses from Vietnam from other studies including H1N1pdm09 from NIHE; black: other sequences from GenBank
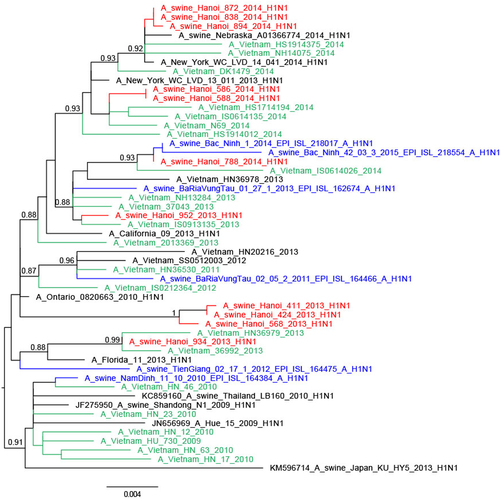
The trees were constructed with PhyML. Branch support aLRT statistics were shown at major nodes with values larger or equal to 0.8. GenBank accession numbers of retrieved sequences are indicated. Red: sequences from our study; blue: sequences from Takemae et al.Citation28; green: viruses from Vietnam from other studies including H1N1pdm09 from NIHE; black: other sequences from GenBank
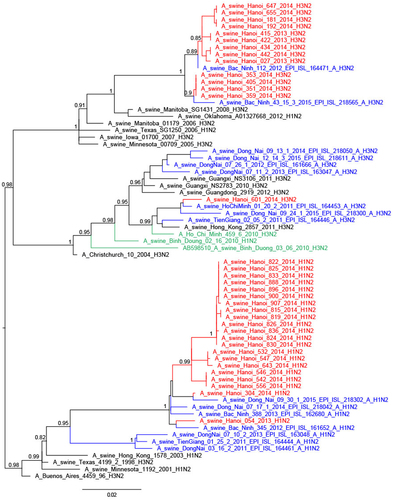
The trees were constructed with PhyML. Branch support aLRT statistics were shown at major nodes with values larger or equal to 0.8. GenBank accession numbers of retrieved sequences are indicated. Red: sequences from our study; blue: sequences from Takemae et al.Citation28; green: viruses from Vietnam from other studies including H1N1pdm09 from NIHE; black: other sequences from GenBank
The trees were constructed with PhyML. Branch support aLRT statistics were shown at major nodes with values larger or equal to 0.8. GenBank accession numbers of retrieved sequences are indicated. Red: sequences from our study; blue: sequences from Takemae et al.Citation28; green: viruses from Vietnam from other studies including H1N1pdm09 from NIHE; black: other sequences from GenBank
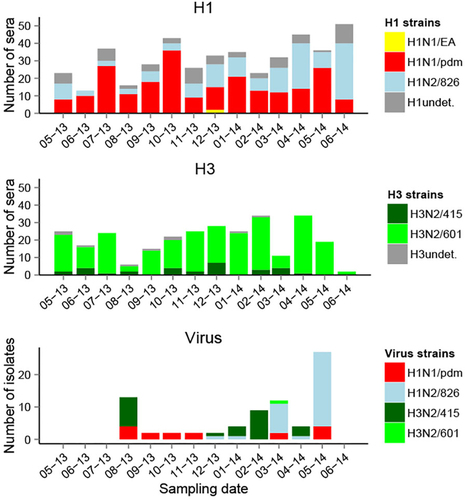
Hemagglutination inhibition seroprevalence for the different strains of influenza A across locations
Undet. undetermined strain, i.e., HI titer positive to several H1 or H3 strains with a titer difference < 4-fold. Viruses were isolated at the collective slaughterhouse
Logistic regression results for the different influenza A strains