
Figures & data
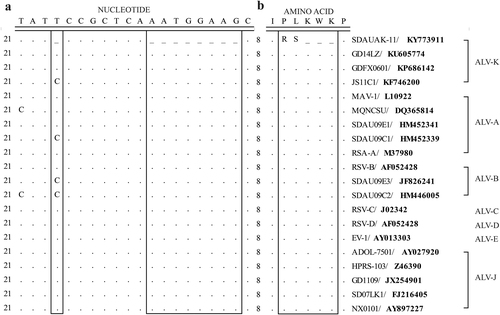
a Nucleotide sequence comparison. b Amino acid sequence comparison. Boxes indicate the genetic difference between the SDAUAK-11 and reference strains
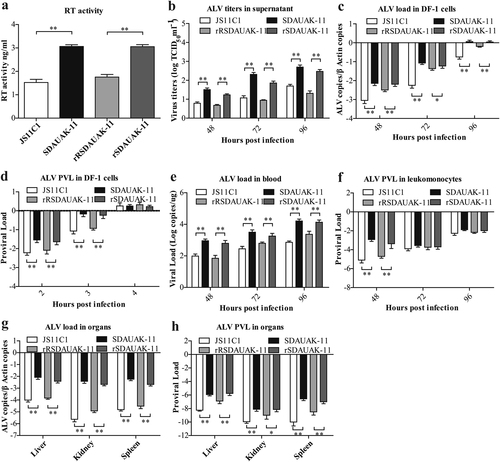
a The results of the reverse transcriptase activity (RT) assays performed with equivalent virus particle amounts (five million copies) isolated from the cell culture supernatants of DF-1 cells infected or transfected with SDAUAK-11 (wild strain), JS11C1 (wild strain), rSDAUAK-11 and rRSDAUAK-11 are shown. b Virus titers for these viruses in DF-1 cell culture supernatant at 48, 72, and 96 HPI and viral titers harvested at different intervals were calculated and expressed as TCID50 per milliliter using Reed-Muench methods. c Viral loads for these viruses at 48, 72 and 96 HPI were determined by the presence of ALV in DF-1 cells (106 cells) treated with different virus strains (five million copies) using QRT-PCR methods, and ALV viral load levels were normalized to beta-actin. d Proviral loads (PVLs) for those viruses at 2, 3, and 4 HPI were determined by the presence of ALV-cDNA in DF-1 cells (106 cells) treated with different virus strains (five million copies) using QRT-PCR, and ALV PVL levels were normalized to HMG14b. e Viral loads for these viruses at 48, 72 and 96 HPI were determined by the presence of ALV in the blood of SPF chicks treated with different virus strains (five million copies) using QRT-PCR, and the viral RNA concentration (log10) was normalized per 1 µg of total RNA. f PVLs for those viruses at 48, 72 and 96 HPI were determined by the presence of ALV-cDNA in the leukomonocytes of SPF chicks treated with different virus strains (five million copies) using QRT-PCR methods, and ALV proviral load levels were normalized to HMG14b. g Viral loads for these viruses at 48, 72 and 96 HPI were determined by the presence of ALV in the liver, kidney and spleen of SPF chicks treated with different virus strains (five million copies) using QRT-PCR, and ALV viral load levels were normalized to beta-actin. h PVLs for these viruses at 48, 72 and 96 HPI were determined by the presence of ALV-cDNA in the liver, kidney and spleen of SPF chicks treated with different virus strains (five million copies) using QRT-PCR methods, and ALV PVL levels were normalized to HMG14b. The standard deviations from independent experiments are shown. P value (*P < 0.05, **P < 0.01) determined by Duncan’s multiple-range test is shown
a Viral load proportion (VLP) for rSDAUAK-11, rRSDAUAK-11, SDAUAK-11 (wild strain), and JS11C1 (wild strain) in DF-1 cells (106 cells) treated simultaneously with these viruses (five million copies and five million copies) or culture supernatant at 48, 72 and 96 HPI, and the VLP of each sample harvested at different intervals was calculated as VLP (JS11C1) = VL (JS11C1)/[VL (SDAUAK-11) + VL (JS11C1)]. Primers rR-F and rR-R were used to quantify the viral load of JS11C1, and primers r-F and r-R were used to quantify the total viral load of SDAUAK-11 and JS11C1. The same methods were used to analyze the rescued viruses and subsequent tests. b VLP for ALVs in DF-1 cells treated simultaneously with two wild/rescued ALVs at 48, 72, and 96 HPI. c PVL proportion for ALVs in DF-1 cells treated simultaneously with two wild/rescued ALVs at 48, 72, and 96 HPI. d VLP for ALVs in the blood of SPF chicks treated simultaneously with two wild/rescued ALVs. € PVL for ALVs in leukomonocytes of SPF chicks treated simultaneously with two wild/rescued ALVs. f VLP for ALVs in liver, kidney and spleen of SPF chicks treated simultaneously with two wild/rescued ALVs. g PVL proportion for ALVs in liver, kidney and spleen of SPF chicks treated simultaneously with two wild/rescued ALVs. The standard deviations from independent experiments are shown. P value (*P < 0.05, **P < 0.01) determined by Duncan’s multiple-range test is shown
![Fig. 3 Effects of mutations in the pol gene on the competition advantage both in vitro and in vivoa Viral load proportion (VLP) for rSDAUAK-11, rRSDAUAK-11, SDAUAK-11 (wild strain), and JS11C1 (wild strain) in DF-1 cells (106 cells) treated simultaneously with these viruses (five million copies and five million copies) or culture supernatant at 48, 72 and 96 HPI, and the VLP of each sample harvested at different intervals was calculated as VLP (JS11C1) = VL (JS11C1)/[VL (SDAUAK-11) + VL (JS11C1)]. Primers rR-F and rR-R were used to quantify the viral load of JS11C1, and primers r-F and r-R were used to quantify the total viral load of SDAUAK-11 and JS11C1. The same methods were used to analyze the rescued viruses and subsequent tests. b VLP for ALVs in DF-1 cells treated simultaneously with two wild/rescued ALVs at 48, 72, and 96 HPI. c PVL proportion for ALVs in DF-1 cells treated simultaneously with two wild/rescued ALVs at 48, 72, and 96 HPI. d VLP for ALVs in the blood of SPF chicks treated simultaneously with two wild/rescued ALVs. € PVL for ALVs in leukomonocytes of SPF chicks treated simultaneously with two wild/rescued ALVs. f VLP for ALVs in liver, kidney and spleen of SPF chicks treated simultaneously with two wild/rescued ALVs. g PVL proportion for ALVs in liver, kidney and spleen of SPF chicks treated simultaneously with two wild/rescued ALVs. The standard deviations from independent experiments are shown. P value (*P < 0.05, **P < 0.01) determined by Duncan’s multiple-range test is shown](/cms/asset/18ac903c-003b-4a84-95dd-77b8e2595047/temi_a_12040018_f0003_ob.jpg)
ALV-positive rate of different groups both in the primary and offspring generations
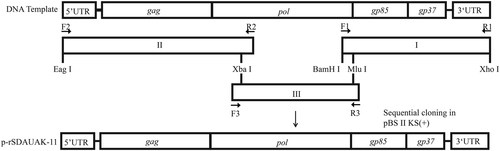
F1/R1, F2/R2, and F3/R3 were primers used for amplification of the whole genome of SDAUAK-11. Xba I and Mlu I were restriction enzyme sequences located in the genome itself, while Eag I, BamH I, and Xho I were incorporated into the amplicons. With the exception of Mlu I, the other four restriction enzymes can be found in pBlueScript II KS. Amplicons I, II, and III were inserted into pBlueScript II KS in order using restriction enzyme digestion. Amplicon I was first inserted into pBlueScript II KS via BamH I and Xho I; amplicon II was then inserted via Eag I and Xba I; and finally, amplicon III was inserted into the genome itself via Xba I and Mlu I
Primers used in this study