Figures & data
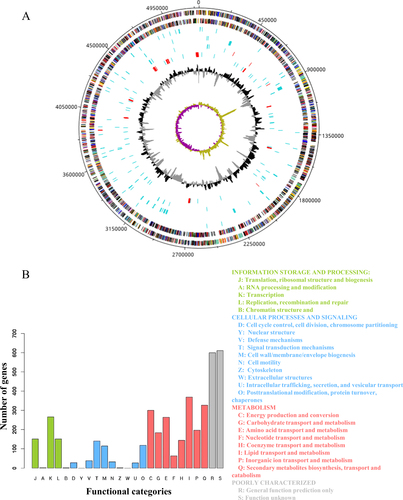
a From outermost to innermost tracks are plus-strand protein-coding genes, minus-strand protein-coding genes, tRNAs (blue) or rRNAs (red, three rRNAs are too close to each other to be seen as separate genes at this scale), genomic islands, insertion sequences (blue) or CRISPRs (red), pseudogenes (blue) or prophage sequences (red), GC content and GC skew, respectively. b Functional categories of protein-coding genes by COG or NOG annotation. Four different colours and capital letter A to Z represent four top-level functional categories
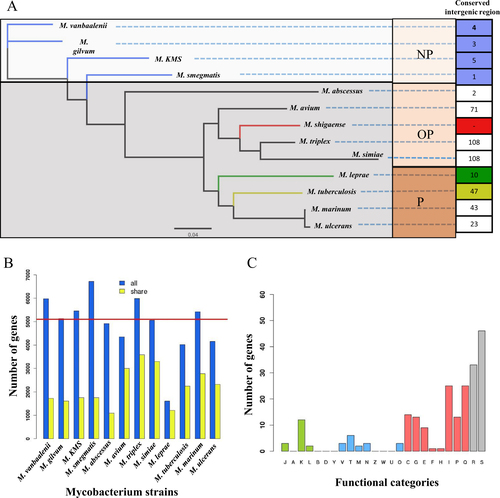
a The phylogenetic tree built from 682 single-copy orthologous genes shared by all of 13 strains. Conserved intergenic region means the numbers of intergenic regions with high similarity between M. shigaense and each of the other 12 strains. b The numbers of homologous genes between M. shigaense and each of the other 12 strains. The red line indicates the number of M. shigaense genes. c Functional categories of genes with high similarity only for M. shigaense, M. triplex, M. simiae and M. avium (Fig. shows meanings of different colours and capital letters). P pathogens, OP opportunistic pathogens, NP non-pathogens
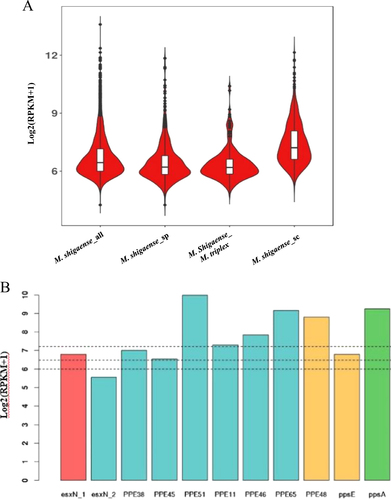
a Distribution of expression levels of M. shigaense gene groups indicated by suffixes ‘all’ for all 5098 genes, ‘sp’ for specific (not in M. triplex or M. tuberculosis) and ‘sc’ for single-copy orthologous genes in three species. M. shigaense_M. triplex represent genes common to M. shigaense with M. triplex expressed in M. shigaense. b Gene expression of M. shigaense homologs of M. tuberculosis virulent genes. The three dashed lines represent the quartile of all gene expression levels in M. shigaense
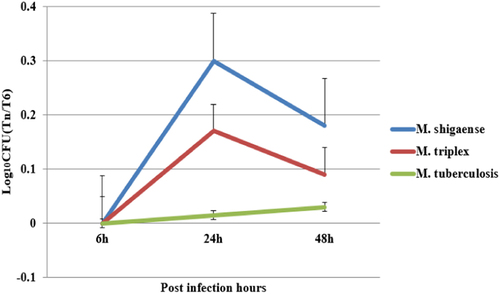
Macrophages were infected with bacteria cultured on L–J medium. The intracellular bacteria were harvested from the macrophages at 6 h, 24 h, 48 h post infection and plated on L–J medium. The colony forming units were counted and plotted as Log10CFU counts. M. shigaense and M. triplex shared a similar trend of increase in Log10CFU from 6 h to 24 h post infection and a decrease from 24 h to 48 h post-infection, whereas M. tuberculosis underwent slow growth from 6 h to 48 h post-infection
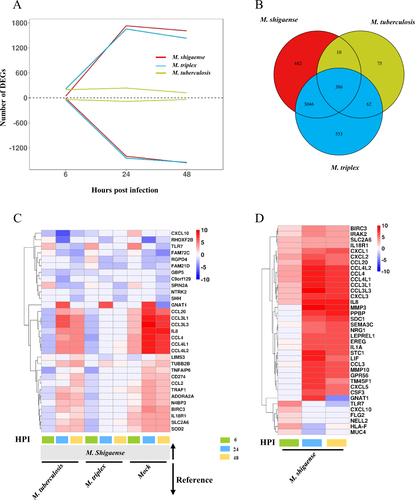
a The number of differentially expressed genes (DEGs) at three time points. Above zero indicates up-regulation. Below zero indicates down-regulation. b The number of overlapped DEGs between three strains. c DEGs only for M. shigaense compared with other two strains and mock group. HPI represents hours post infection. d Gene expression signature of top 20 upregulated DEGs from each time point of M. shigaense. Red indicates up-regulation, and blue indicates down-regulation. The colours (c, d) denote log2FC(Fold Change) of gene expression
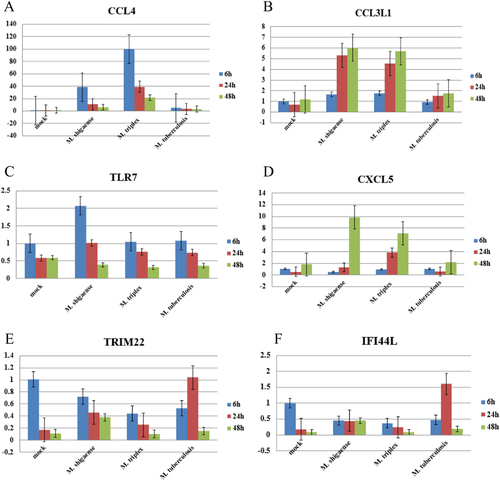
Six differentially expressed genes (a–f) were detected at 6, 24 and 48 h post infection among M. shigaense, M. triplex, M. tuberculosis and mock group. Data are expressed as the mean and standard deviation (±) of three independent experiments. The expressed levels of special genes were in accordance with the results of RNA sequencing