
Figures & data
Demographics and clinical characteristics of participants
a Shannon index: t test; b Simpson index: Mann–Whitney test
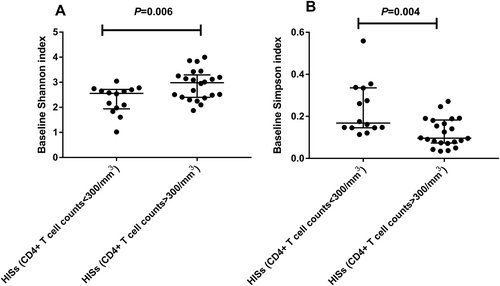
Fig. 2 Characterization of β-diversity of intestinal microbiota in HISs at baseline and follow-up by PCoA (the paired baseline and follow-up samples were connected with lines. a HISs with baseline CD4+ T cell counts <300/mm3; b HISs with baseline CD4+ T cell counts >300/mm3
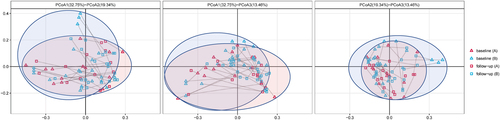
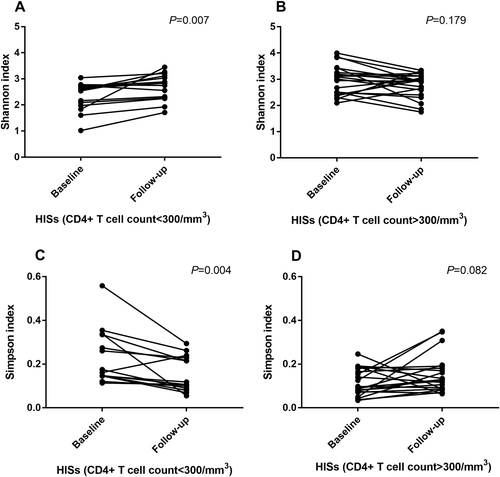
Fig. 3 Paired comparisons (pairedttest) of α-diversity indices in HISs before and after cART treatment. a Analysis of the Shannon index in HISs with baseline CD4+ T cell counts <300/mm3; b Analysis of the Shannon index in HISs with baseline CD4+ T cell counts >300/mm3; c Analysis of the Simpson index in HISs with baseline CD4+ T cell counts <300/mm3; d Analysis of the Simpson index in HISs with baseline CD4+ T cell counts >300/mm3)
a HISs with baseline CD4+ T cell counts <300/mm3; b HISs with baseline CD4+ T cell counts >300/mm3
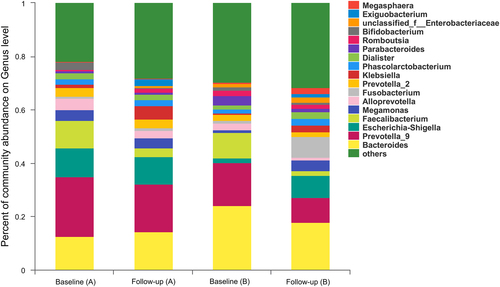
Alterations of gut microbiota composition in HIV positive participants with cART introduction