Figures & data
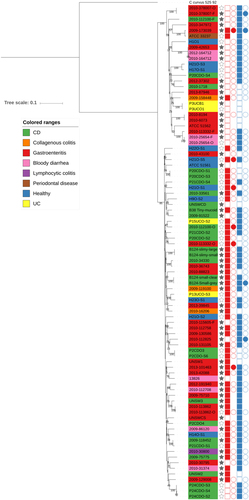
Characteristics and phenotype data for Campylobacter concisus strains used in the study
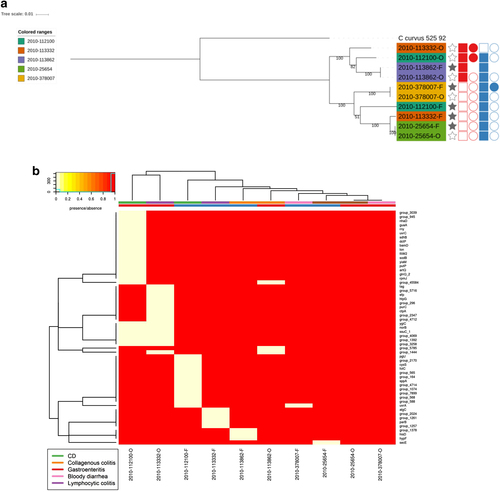
Columns: Full stars represent Faecal samples, empty stars represent Oral samples. Squares represent presences in genome assemblies and circles presence in plasmid assemblies. Red represents Exo9 whilst blue represents ZOT presence. Full shapes indicate presence, empty shapes indicate absence. For plasmids, there are some samples with no shape, this indicates that plasmidSPAdes software was unable to assemble any plasmids for the sample
Clinical source of strains based on ZOT and Exotoxin 9 positivity as well as the percentage of isolates that belonged to Genomospecies (GS) I and II
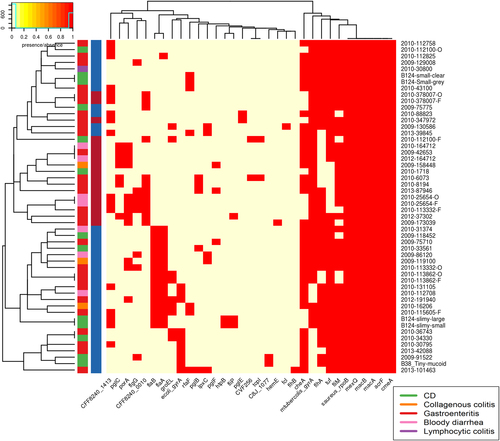
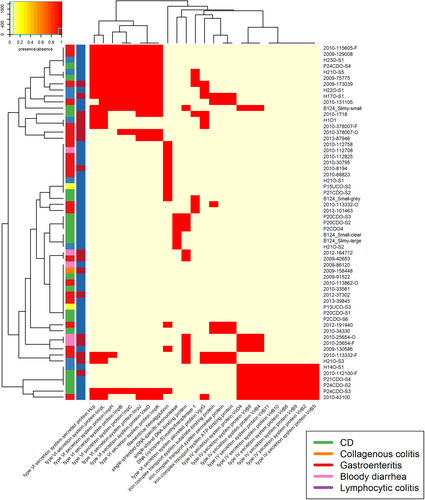
Contains VFDB hits from the VFDB all dataset. Virulence factors were detected using the Comprehensive Antibiotic Resistance Database (CARD) and the Virulence Factor Database (VFDB). There are two colour columns representing metadata for the samples. The first represents the disease presentation of the host with a legend available. The second represent the genomospecies (GS) of the isolate with “red” referring to GSI and “blue” to GSII
There are two colour columns representing metadata for the samples. The first represents the host disease presentation with a legend available. The second represent the GS of the isolate with red referring to GSI and blue to GSII
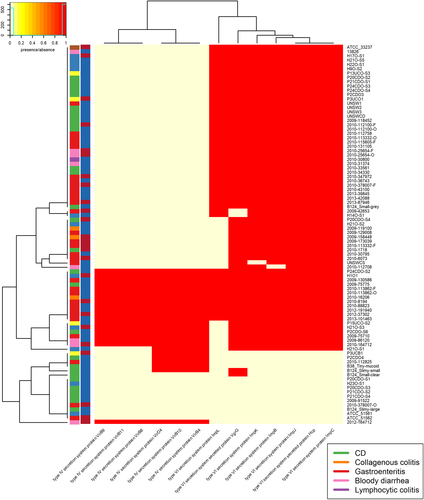
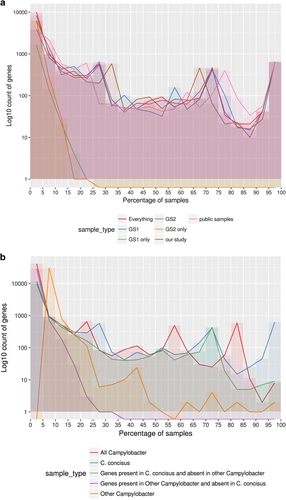
Fig. 4 a Pangenome summary of all C. concisus used in this study. The figure displays the number of genes found to be shared across a certain percentage of samples in different groupings of isolates. This figure uses a bin size of 5% on the x-axis. GS Genomospecies, and b Pangenome summary of all Campylobacter. This was produced by carrying out pangenome analysis of all the C. concisus isolates and one reference assembly for each non-C. concisus species that was available. The figure displays how many genes were found to be shared across a certain percentage of samples in different groupings of isolates. The figure depicts a bin size of 5% on the x-axis
Hierarchies which were shared by five or fewer isolates were not included. There are two colour columns representing metadata for the samples. The first represents host disease presentation with a legend available. The second represent the GS of the isolate with “red” referring to GSI and “blue” to GSII
Phylogenetic tree of faecal/oral paired samples based on the whole genome and b Heatmap of genes found to be core only in oral samples and core in only faecal samples from oral/faecal paired samples. Columns: Full stars represent faecal samples, empty stars represent oral samples. Squares represent presence in genome assemblies and circles presence in plasmid assemblies. “Red” represents Exo9 whilst “blue” represents ZOT presence. Full shapes indicate presence, empty shapes indicate absence. For plasmids, there are some samples with no shape. This indicates that plasmids were not assembled for this sample. Heatmap: There are two colour rows representing metadata for the samples. The first represents the host disease presentation with a legend available. The second represent the GS of the isolate with “red” referring to GSI and “blue” to GSII