Figures & data
Rodents captured in three localities from Acre state, Brazil, 2015–2016, by species and locality
Fig. 1 Municipalities of Acre state, Brazil, in which rodents were captured
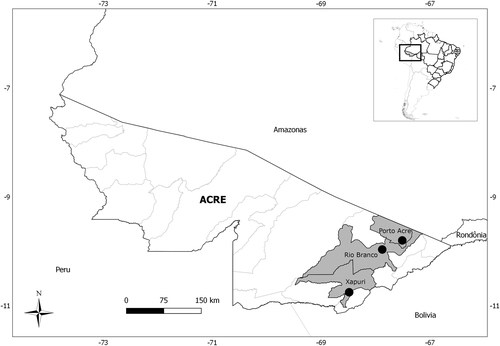
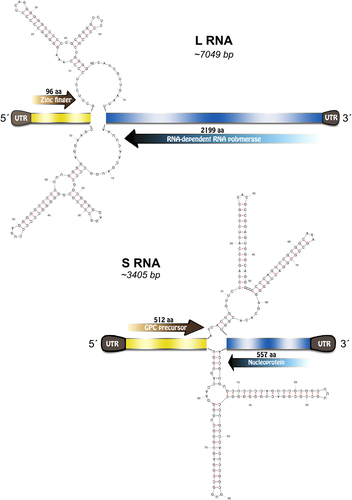
Fig. 2 Xapuri mammarenavirus genome organization and potential secondary structure of intergenic regions
Nucleotide and amino acid identities of XAPV compared with New World representatives of the genus Mammarenavirus
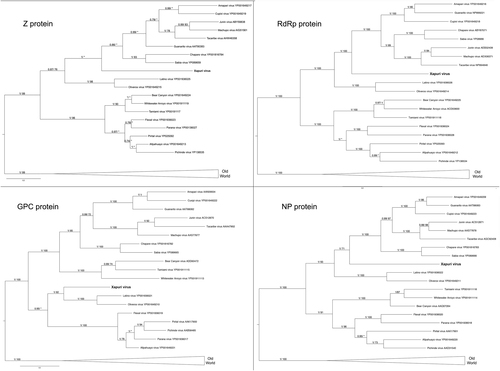
. Numbers (≥0.7/≥70) above branches indicate node probabilities or bootstrap values (MrBayes/ML). Asterisks indicate values below 0.7/70. Sequences from this study are highlighted in bold
. Numbers (≥0.7/≥70) above branches indicate node probabilities or bootstrap values (MrBayes/ML). Asterisks indicate values below 0.7/70. Sequences from this study are highlighted in bold
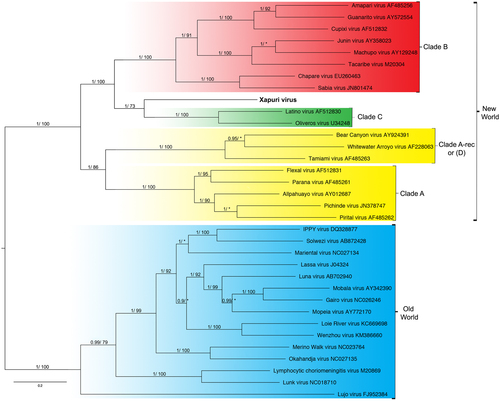
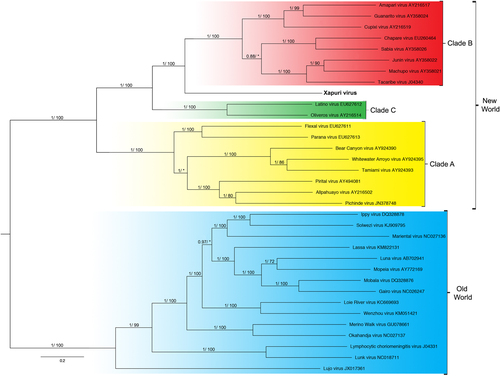
Numbers (≥0.7/≥70) above branches indicate node probabilities or bootstrap values (MrBayes/ML). Asterisks indicate values below 0.7/70. †Exhibited a difference between ML and MrBayes tree-building method topologies. Sequences from this study are highlighted in bold