
Figures & data
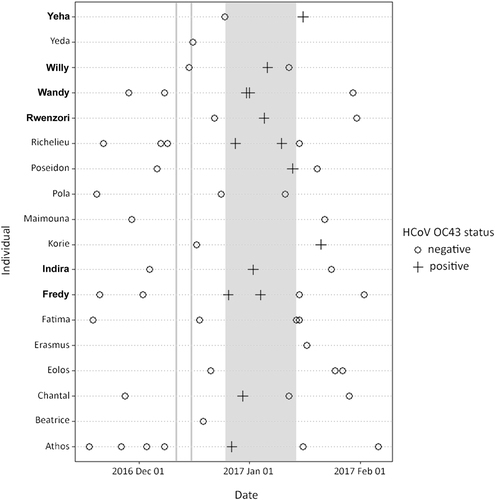
Each line represents an individual. Bold names represent consistently symptomatic individuals. Gray shadowing indicates the time frame of symptoms’ observation in the group. Vertical grey lines correspond to the dates in which human quarantine swabs were positive
Supplemental material