Figures & data
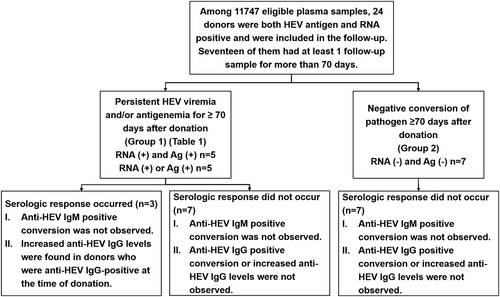
Among these 17 donors, 10 showed persistent viremia and/or antigenemia for ≥70 days after donation and increased anti-HEV IgG levels were observed in 3 donors. The other 7 donors showed negative conversion of pathogens (with both HEV antigen and RNA becoming negative) without a serologic response. Increasing IgG: increasing anti-HEV IgG level; Ag: HEV antigen
Characteristics of the donors with long-term HEV viremia and/or antigenemia
IgM, IgG, and IgA quantification and other pathogen markers in donors with persistent HEV viremia
Phylogenetic tree of genotypes 1–4 (a) and genotypes 2 and 4 alone (b). The HEV sequences were based on partial ORF2 nucleotide sequences from blood donors. The sequences from donors 2 and 7 are shown in blue and red, respectively. In the phylogenetic trees for genotypes 2 and 4 alone, the GenBank accession number, virus host, and country of detection are indicated for the reference sequences. The bootstrap values > 70 were shown
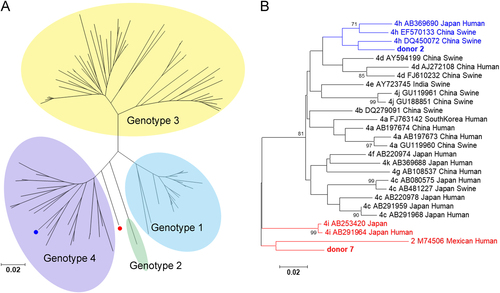
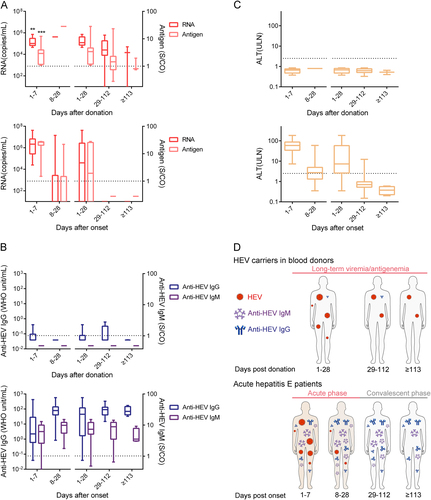
Fig. 3 Dynamics of the HEV pathogen (RNA and antigen) (a), anti-HEV antibodies (IgM and IgG) (b) and ALT levels (c), and models (d) among 10 donors with long-term HEV viremia and/or antigenemia (upper panel) and 20 acute hepatitis E (HE) patients (lower panel) during the follow-up period. Samples were collected from 10 donors who presented with long-term HEV viremia and/or antigenemia from 1 to 7 days (n = 10), 8 to 28 days (n = 1), 1 to 28 days (n = 11), 29 to 112 days (n = 10), and ≥ 113 days (n = 3) after donation. Samples were also collected from 20 HE patients from 1 to 7 days (n = 17), 8 to 28 days (n = 24), 1 to 28 days (n = 41), 29 to 112 days (n = 28), and ≥ 113 days (n = 4) after the onset of symptoms. Dotted lines represent the cut-off levels for the HEV antigen and anti-HEV IgM/IgG values. Viral RNA, HEV antigen, anti-HEV IgM, and anti-HEV IgG values and ALT levels are presented as ranges (whiskers), interquartile ranges (boxes), and medians (lines within the boxes). The differences in RNA and antigen levels between blood donors from 1 to 7 days after donation and HE patients from 1 to 7 days after onset were analyzed using the Mann–Whitney U test. “*”p < 0.05; “**”p < 0.01; “***”p < 0.001