Figures & data
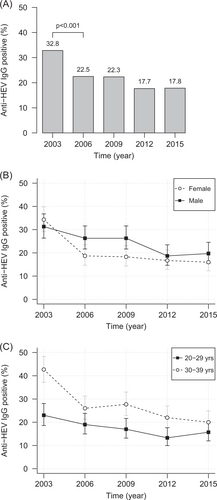
Fig. 1 Trend of anti-HEV IgG prevalence in 2003, 2006, 2009, 2012, and 2015.a Overall prevalences. The chi square test with continuity correction was used to evaluate differences between the anti-HEV IgG prevalences of successive years. b Anti-HEV IgG prevalence and 95% CI divided by gender. c Anti-HEV IgG prevalence and 95% CI divided into age groups. Yrs, years
Anti-HEV IgG prevalence, overall, and by age and gender (percentages and absolute numbers of positives)
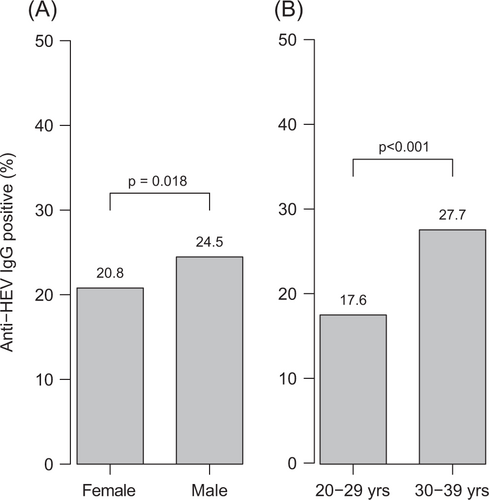
Fig. 2 Gender and age group analysis. Anti-HEV IgG sorted by (a) gender and (b) age groups. Differences in prevalence were evaluated using the chi square test with continuity correction. Yrs, years
Data are shown as box-and-whisker diagrams. The box represents the interquartile range (IQR) between the 25th (Q1) and 75th (Q3) percentiles and includes a median line. Lower and upper whiskers represent Q1−1.5 × IQR and Q3 + 1.5 × IQR, respectively. Open data points show extreme outliers. WU, World Health Organization units
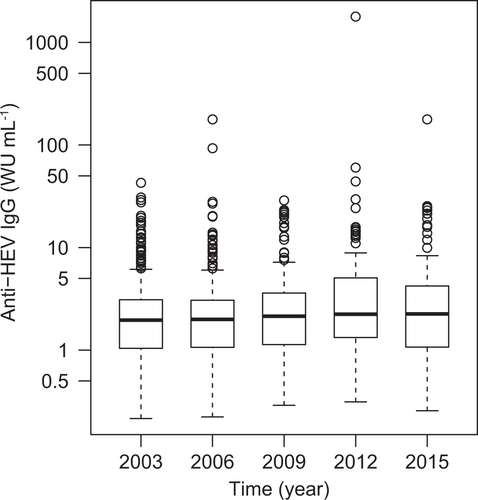
WU, World Health Organization units
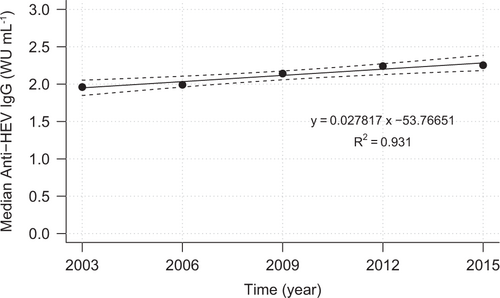
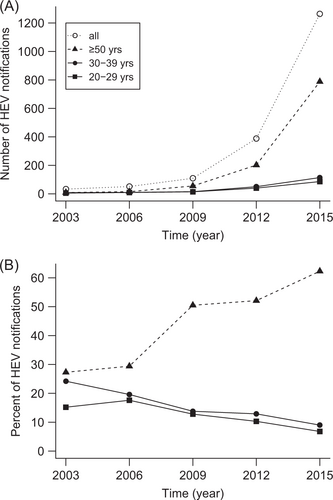
Fig. 5 Hepatitis E notifications in Germany. (a) Absolute numbers and (b) percentage in three selected age cohorts, 2003–2015. Percentages are calculated in relation to all notified cases per year. Yrs years