
Figures & data
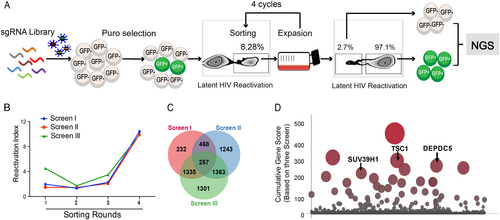
a Overview of the experimental design of the lentiCRISPRv2.0 library screen. Spontaneous latency reversal in C11 cells was quantified by gating GFP+ cells in a flow cytometry assay. Screening was enriched through four rounds, and GFP+ cells were harvested at each round. As a control, the GFP−cell population was also harvested at the last round. High-throughput sequencing was subsequently used to compare selected cells with controls. b Three independent biological replicates of this screen (named screens I, II, and III) are shown. The horizontal coordinates of the line graph represent the number of enrichment rounds, and the vertical coordinates represent the percentage of GFP expression in the experimental group / the percentage of GFP expression in the control group. c Venn diagram of the overlap of all detected sgRNAs from the three replicate screens. d Plot of the scores of the top hits in the screen. The height and size of each dot are proportional to the screening score
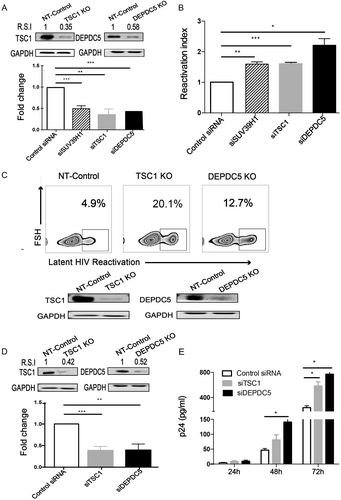
a Knockdown efficacy of TSC1 (left) and DEPDC5 (right) in C11 cells was determined by WB. The representative pattern is shown in upper panel. The siRNA knockdown (%KD) was also detected by qPCR (bottom panel). b Fold activation of DEPDC5, TSC1, and SUV39H1 knocked down in C11 cells without co-stimulation. Analysis was conducted on 5 × 10⁵ live cells per condition, and all experiments were independently repeated at least three times. c Constructed stable knockout of either TSC1 or DEPDC5 in C11 cell lines. NT-control indicates non-targeting sgRNA knockout in C11 cell lines. TSC1 or DEPDC5 knockout led to spontaneous latency reversal compared with the NT-control (upper panel). Knockout efficiency of TSC1 (left) and DEPDC5 (right) in C11 cells was detected by WB. The representative pattern is shown (bottom panel). d Knockdown efficacy of TSC1 (left) and DEPDC5 (right) in U1 cells was determined by WB. The representative pattern is shown in the upper panel. Knockdown efficiency of siRNA in the U1 cell line was also detected by qPCR (bottom panel). e Transient knockdown of TSC1/DEPDC5 in U1 cells resulted in increased p24. The cell supernatants were collected at three time points (24, 48, and 72 h). Data represent the mean ± SD of three independent experiments. The significance of differences between groups was determined using the two-tailed Student’s t-test (***P < 0.005; **P < 0.01, *P < 0.05)
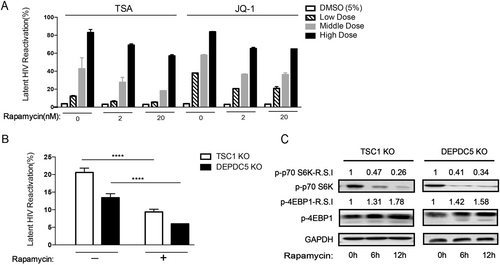
a C11 cell pretreatment with rapamycin (2/20 nM) for 6 h to reactivate HIV in the presence of increasing concentrations of TSA/JQ1. Reactivation of HIV was assessed by measuring GFP by flow cytometry. Data represent the mean ± SD. b The percentage of GFP+ cells upon rapamycin (2 nM) treatment in TSC1/DEPDC5 knockout C11 cells. Data represent the mean ± SD of triplicate values, representative of two independent experiments. The significance of differences between groups was determined using the two-tailed Student’s t-test (****P < 0.001). c Rapamycin stimulates phosphorylation of S6 and 4EBP1 in TSC1/DEPDC5 knockout C11 cells. Cells were untreated or pre-treated with rapamycin (2 nM) for 6 h/12 h. Images shown are representative of three independent experiments
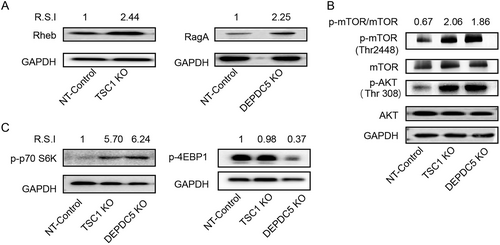
a Left: WB analyses of Rheb expression in the TSC1 knockout cell line. Right: WB analyses of RagA expression in the DEPDC5 knockout cell line. b The effects of DEPDC5 and TSC1 on upstream AKT and downstream mTOR. Phosphorylation of AKT was monitored by the anti-phospho-AKT (S308) antibody. Phosphorylation of mTOR was detected by the anti-phospho-mTOR (S2448) antibody. c Graph showing the effect of DEPDC5 or TSC1 knockout on S6K (left) and 4EBP1 (right) phosphorylation. Images shown are representative of three independent experiments