Figures & data
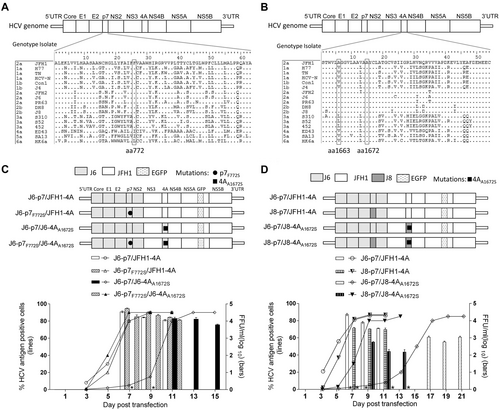
a, b Alignments of p7 and NS4A proteins of HCV genotypes 1–6. c, d Transfection of HCV recombinants with different mutations. The HCV antigen was detected by immunostaining or EGFP, and the percentage of virus positive cells was estimated (left y axis). HCV supernatant infectivity titers at peak infection were determined by the FFU assay (right y axis), and mean ± SEM of three determinations is shown. *, FFU was not determined owing to its low infection rate
Sequence analysis of first-passage HCV recombinants with different p7 and NS4A sequences, with or without engineered mutations
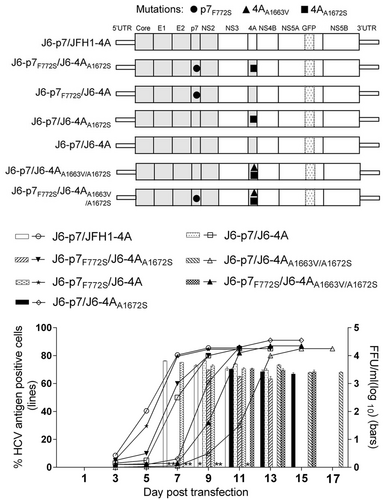
Transfection of HCV recombinants with different mutations. The percentage of infected cells and HCV supernatant infectivity titers were shown. See Fig. legend for details
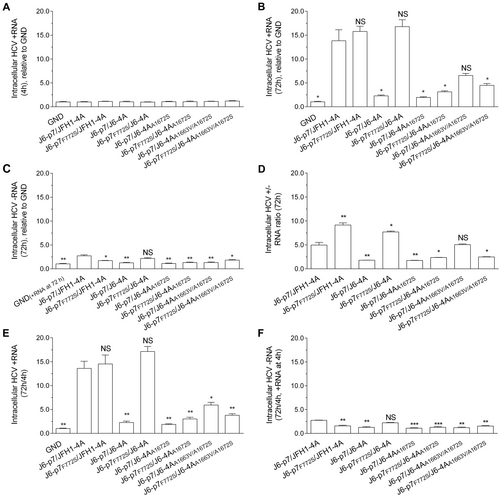
RNA transcripts (10 μg) of different HCV recombinants were transfected into Huh7.5 cells, and the cells were collected at 4 and 72 h p.t. J6/JFH1-EGFP△40-GND (GND) was the control. a HCV +RNA at 4 h p.t. was determined (baseline). b, c Fold-change of HCV +RNA and -RNA at 72 h relative to GND. d The ratio of +/-RNA at 72 h. e, f Fold-change of + RNA and -RNA at 72 h (normalized to 4 h +RNA). The data presented in (a–f) are the average ± SEM of three determinations, and three independent experiments were performed. Statistical significance was calculated against J6-p7/JFH1-4A and is indicated by asterisk(s) (*, p ≤ 0.05; **, p ≤ 0.01; ***, p ≤ 0.001). NS, no significant difference (student’s t test)
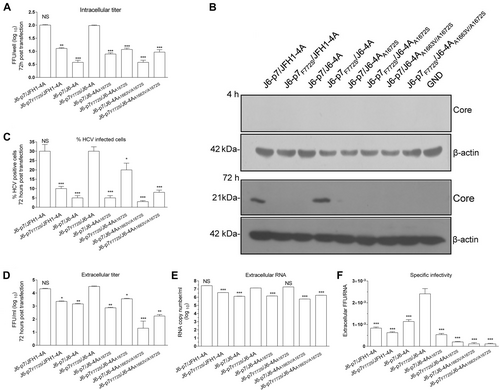
Huh7.5 cells were transfected with RNA transcripts (10 μg) of different HCV recombinants, and the analyses were performed at 72 h p.t. a Intracellular titers were determined (FFU/well). b Western blotting of intracellular HCV Core. c The HCV infection rate was estimated by core immunostaining or NS5A-EGFP expression. d Extracellular infectivity titers (FFU/ml). e Extracellular RNA titers (copy/ml). f Specific infectivity (FFU/RNA ratio). See Fig. legend for the detailed annotations
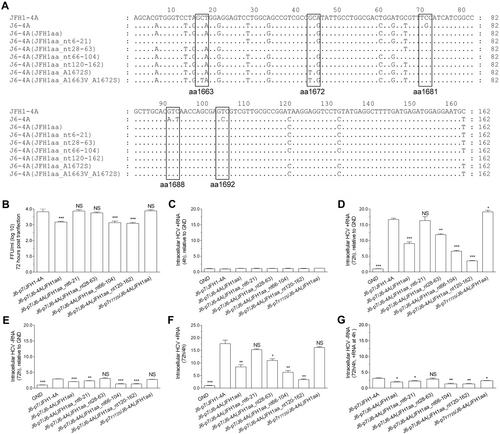
Recombinants expressing JFH1-type NS4A were transfected into Huh7.5 cells, and the analyses were performed at 4 h and 72 h p.t. a RNA sequence of J6-JFH1 NS4A chimeras. b The infectivity titers of JFH1 NS4A-expressing recombinants. c HCV +RNA at 4 h p.t. (baseline). d, e Fold-change of +RNA and -RNA at 72 h p.t. relative to GND. f, g Fold-change of +RNA and -RNA at 72 h (normalized to 4 h +RNA). The data in c–g are the average ± SEM (n = 3). See Fig. legend for the detailed annotations
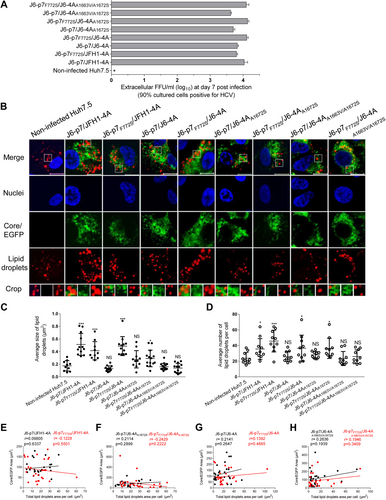
Huh7.5 cells were infected with HCV (MOI = 0.1), and ~90% of cells were HCV positive at day 7. The cells were fixed and stained for HCV and LDs. a The supernatant infectivity titers at day 7 post infection. b Images of HCV antigens (Core/NS5A-EGFP) (green), nuclei (blue), LD (red), and the merged images. Bar, 10 μm. c The average size of LDs in HCV positive Huh7.5 cells (10–15 cells). d The average numbers of LDs per Huh7.5 cell positive for HCV (by ImageJ software). See Fig. legend for the annotations of statistical analysis. e–h The correlation analysis of the total HCV protein and the formation of LDs in 26 HCV-infected cells using ImageJ software. Correlation coefficient (r value) and p value are shown. p ≤ 0.05 indicates a statistically correlation, in which the higher r value suggests the stronger correlation