Figures & data
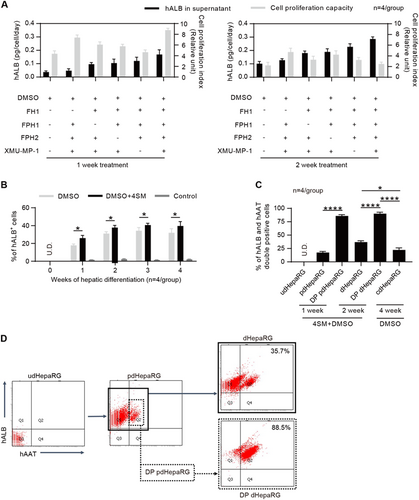
a Measurements of hALB in the supernatant of the culture medium and cell proliferation capacity of HepaRG cells with the FH1, FPH1, FPH2 and XMU-MP-1 treatment in the one-minus treatment pattern (n = 4/group) for 1 (left panel) or 2 weeks (right panel). b FACS analysis for the hALB-positive rate of HepaRG cells treated or untreated with 4SM from weeks 0 to 4 in the hepatic differentiation procedure (n = 4/group). c FACS analysis of the hALB and hAAT double-positive (DP) rate of cells using the hepatic differentiation procedure that was optimized by 4SM treatment and cell enrichment; udHepaRG and cdHepaRG cells were used as controls. d Representative FACS plot for developing DP cells using the 4SM-enhanced hepatic differentiation procedure with or without cell enrichment. (*P < 0.01; ****P < 0.00001; NS no significant difference, U.D. undetectable)
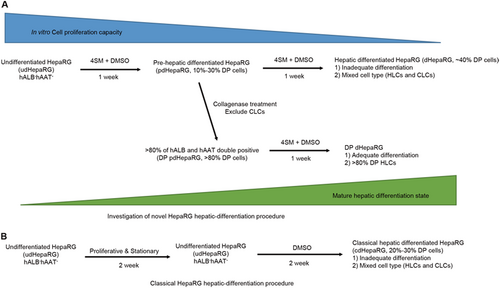
a Investigation of the optimized 2-week hepatic differentiation procedure including 4SM treatment and enrichment of precursor HLCs (DP pdHepaRG). b Classic 4-week hepatic differentiation procedure with only DMSO treatment
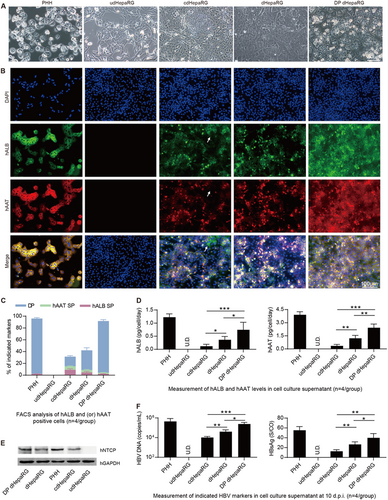
a Morphology of PHH, udHepaRG, cdHepaRG, dHepaRG and DP dHepaRG cells (bar = 50 μm). b IF staining for hALB (green), hAAT (red) and nuclei (blue) of PHH, udHepaRG, cdHepaRG, dHepaRG and DP dHepaRG cells. The single-positive cells in cdHepaRG are indicated by white arrowheads. PHH was used as a positive control (bar = 100 μm). c FACS analysis of either hALB- or hAAT- or double-positive PHH, udHepaRG, cdHepaRG, dHepaRG and DP dHepaRG cells (n = 4/group). d ELISA measurements of hALB (left panel) or hAAT (right panel) levels in the cell culture supernatant of PHH, udHepaRG, cdHepaRG, dHepaRG and DP dHepaRG cells (n = 4/group). e Western blot examination of the expression of control (hGAPDH) or hNTCP protein in PHH and HepaRG cells in different hepatic differentiation states. f Measurements of HBV DNA (left panel) or HBsAg (right panel) levels in the cell culture supernatant of PHH or HepaRG cells in different hepatic differentiation states at 10 days post-HBV infection (n = 4/group). (*P < 0.01; **P < 0.001; ***P < 0.0001; NS no significant difference, U.D. undetectable)
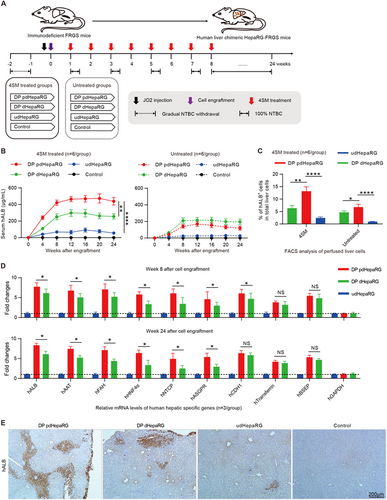
a Schematic diagram of the experimental plan for engraftment of HepaRG cells in different hepatic differentiation states to liver failure FRGS mice with or without 4SM treatment. FRGS mice without engraftment were used as a control. b ELISA assays to determine the serum hALB levels at weeks 0 to 24 post-engraftment (n = 6/group). c FACS analysis to examine the ratio of hALB+ cells in the liver of the engrafted FRGS mice with 4SM treatment at weeks 8 and 24 after engraftment. FRGS mice without cell engraftment were used as a control (n = 6/group). d qRT-PCR to detect the mRNA levels of control (hGAPDH) or nine typical human hepatocyte-specific genes in hALB+ cells from the engrafted FRGS mice treated with 4SM at week 8 and 24 after engraftment (n = 3/group). e IHC to visualize hALB-positive cells in liver tissues from the engrafted FRGS mice with 4SM treatment at week 24 post-engraftment (bar = 200 μm). (*P < 0.01; **P < 0.001; ****P < 0.00001; NS no significant difference, U.D. undetectable)
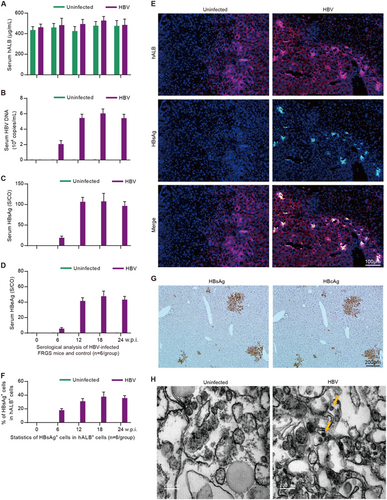
ELISA to determine the levels of serum (a) hALB, (c) HBsAg and d HBeAg, and qRT-PCR to determine the levels of b HBV DNA in uninfected control and HBV-infected HepaRG-FRGS mice from 0 to 24 w.p.i. (n = 6/group). e IF assay of hALB and HBsAg-positive cells in frozen section collected from liver tissues of the uninfected control and HBV-infected HepaRG-FRGS mice at 12 w.p.i. (bar = 100 μm). Cell nuclei were stained with DAPI. f Statistical analysis of the ratio of HBsAg+ cells in hALB+ cells in different views (n = 6/group). g IHC assay of HBsAg and HBcAg expression in serial sections collected from HBV-infected HepaRG-FRGS mice at 12 w.p.i. (bar = 200 μm). h ITEM images of intracellular HBV virions in hALB-positive cells collected from the uninfected control and HBV-infected HepaRG-FRGS mice. The HBV virions were labeled with 5-nm colloidal gold particles (bar = 200 nm)
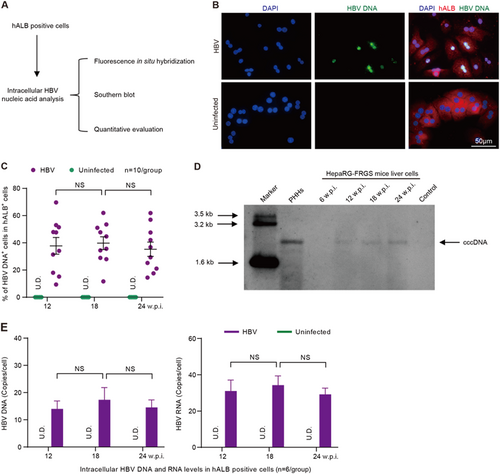
a Schematic diagram of intracellular HBV DNA and RNA in hALB-positive cells from the liver of HBV-infected HepaRG-FRGS mice. b FISH analysis to visualize HBV DNA replication and determine the ratio of HBV DNA+ cells (green) in hALB+ cells (red) from the uninfected control or HBV-infected HepaRG-FRGS mice at 12 w.p.i. (bar = 50 μm). c Statistics for the ratio of HBV DNA+ cells in different views of the FISH analysis (n = 10/group). d Southern blot analysis to detect intracellular HBV cccDNA in hALB+ cells from the uninfected control (line 7) or HBV-infected HepaRG-FRGS from 6 to 24 w.p.i. (lines 3–6) and from HBV-infected PHHs (line 2). e Measurement of intracellular HBV DNA and RNA levels in hALB-positive cells collected from uninfected control and HBV-infected HepaRG-FRGS mice from 12 to 24 w.p.i. (n = 6/group). (NS no significant difference, U.D. undetectable)
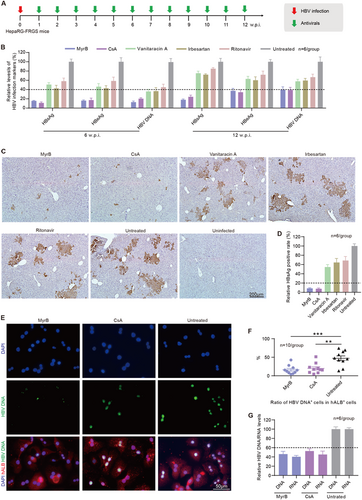
a Schematic diagram of the treatment of anti-HBV entry inhibitors in HBV-infected HepaRG-FRGS mice. b Serum HBsAg, HBeAg and HBV DNA levels of the untreated control and HBV-infected FRGS mice with anti-HBV entry inhibitor treatment at 6 and 12 w.p.i. (n = 6/group). c IHC staining for HBsAg+ cells in liver tissues collected from untreated control and HBV-infected FRGS mice with anti-HBV entry inhibitor treatment at 12 w.p.i. (bar = 200 μm). d Statistics for HBsAg+ cells in liver tissues in different views (n = 6/group). e FISH analysis of HBV DNA+ cells in hALB+ cells collected from untreated control and HBV-infected FRGS mice with MyrB or CsA treatment at 12 w.p.i. (bar = 50 μm). f Statistics for HBV DNA+ cells in hALB+ cells in different views (n = 10/group). g Measurement of intracellular HBV DNA and RNA levels in hALB+ cells collected from untreated control and HBV-infected FRGS mice with MyrB or CsA treatment at 12 w.p.i. (n = 6/group). (**P < 0.001; ***P < 0.0001; NS no significant difference, U.D. undetectable)