
Figures & data
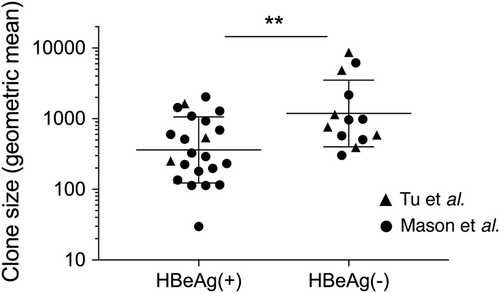
Hepatocyte clones detected in HBeAg-positive (n = 22) and HBeAg-negative (n = 13) groups in Tu et al.Citation18 and Mason et al.Citation17,Citation19 were estimated by copy number of repeated virus-cell junctions contained in these cellular clones. Only accurately determined clone sizes using repeated virus-cell junctions detected in liver fragments (and not from liver slide sections or laser-microdissected material) were included for this comparison. Geometric mean ± SD; **p < 0.01, two-sided Mann–Whitney test
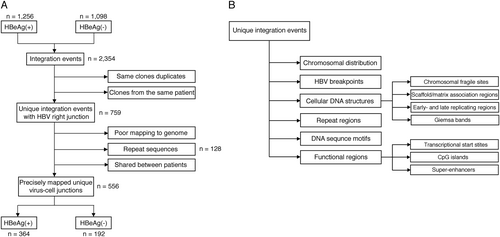
Flowcharts describing the analysis workflow to identify unique virus-cell junctions in HBeAg-positive and HBeAg-negative patients (a), and integration in the proximity of various cellular genomic features, including structural and functional regions (b)
Patient numbers per group in the datasets used in this study
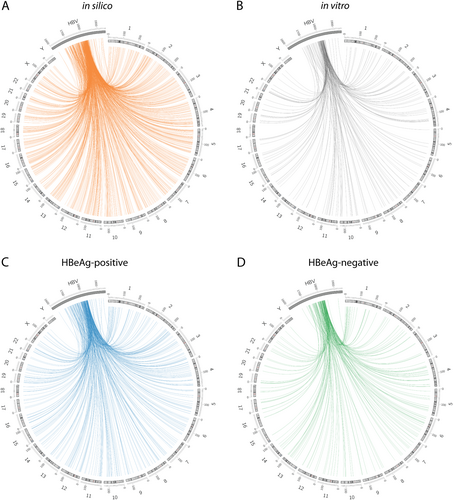
Distribution of the integration breakpoints across human chromosomes and in the HBV genome. Each line represents an integration event at a particular locus in the HBV and human genome (hg38) in the in silico dataset (a), in vitro dataset (b), HBeAg-positive patients (c), and HBeAg-negative patients (d). Chromosome numbers are shown on the outer rim. Viral integration breakpoints were randomly produced in the in silico model based on the frequency distribution of HBV junctions observed in the in vitro and in vivo datasets. It should be noted that the HBV genome has been expanded in scale and cropped to the area analyzed by invPCR to show more detailed positional information
Percentages of HBV integration junctions in each dataset [in silico (gold), in vitro (gray), HBeAg-positive (blue), and HBeAg-negative (green)] were calculated with respect to (a) occurrence in chromosomal fragile sites (CFS), b proximity to S/MAR, and c occurrence in early-/late-replication timing regions (early replication (ER), mid replication (MR) and late replication (LR) regions of the host cell genome, and not distinguished (ND)). **p < 0.01 and ***p < 0.001, Normal approximation z-test
![Fig. 4 Cellular structural features in proximity to HBV DNA integration junctions.Percentages of HBV integration junctions in each dataset [in silico (gold), in vitro (gray), HBeAg-positive (blue), and HBeAg-negative (green)] were calculated with respect to (a) occurrence in chromosomal fragile sites (CFS), b proximity to S/MAR, and c occurrence in early-/late-replication timing regions (early replication (ER), mid replication (MR) and late replication (LR) regions of the host cell genome, and not distinguished (ND)). **p < 0.01 and ***p < 0.001, Normal approximation z-test](/cms/asset/703bcdcf-fb3e-4d1c-befc-15a90dbb3017/temi_a_12040052_f0004_ob.png)
HBV DNA integration into cellular repeat regions
Percentages of HBV integration junctions in each dataset [in silico (gold), in vitro(gray), HBeAg-positive (blue), and HBeAg-negative (green)] were calculated with respect to occurrence in functional regions [separated into intergenic, intronic, exonic regions, promoters, UTRs and non-coding RNAs (ncRNA) (a)]. We also measured the distance from the transcriptional start site (TSS) of the closest gene (b) and the nearest CpG island (both upstream and downstream) (c). The frequency is shown as a percentage of all integration events per dataset. *p < 0.05, **p < 0.01, ***p < 0.001 and ****p < 0.0001, Normal approximation z-test
![Fig. 5 Cellular functional features in proximity to HBV DNA integration junctions.Percentages of HBV integration junctions in each dataset [in silico (gold), in vitro(gray), HBeAg-positive (blue), and HBeAg-negative (green)] were calculated with respect to occurrence in functional regions [separated into intergenic, intronic, exonic regions, promoters, UTRs and non-coding RNAs (ncRNA) (a)]. We also measured the distance from the transcriptional start site (TSS) of the closest gene (b) and the nearest CpG island (both upstream and downstream) (c). The frequency is shown as a percentage of all integration events per dataset. *p < 0.05, **p < 0.01, ***p < 0.001 and ****p < 0.0001, Normal approximation z-test](/cms/asset/20b670ff-5a13-4d78-85f5-959f8616affe/temi_a_12040052_f0005_ob.png)
Tissue transcriptional expression levels [mean fragments per kilobase per million mapped reads (FPKM) ± SD] of genes containing HBV DNA integration is shown for 9 normal tissues (liver, kidney, lung, colon, thyroid, breast, brain, heart and white blood cells) and Huh7 cells infected with HBV (a). Outliers were excluded using Robust regression and Outlier removal (ROUT) method. Percentages of HBV integrations in genes that were either expressed or not expressed in Huh7 (in silico and in vitro datasets) and liver tissue (in silico and in vivo datasets) (b). **p < 0.01, Normal approximation z-test
![Fig. 6 Tissue expression of genes containing HBV DNA integrations.Tissue transcriptional expression levels [mean fragments per kilobase per million mapped reads (FPKM) ± SD] of genes containing HBV DNA integration is shown for 9 normal tissues (liver, kidney, lung, colon, thyroid, breast, brain, heart and white blood cells) and Huh7 cells infected with HBV (a). Outliers were excluded using Robust regression and Outlier removal (ROUT) method. Percentages of HBV integrations in genes that were either expressed or not expressed in Huh7 (in silico and in vitro datasets) and liver tissue (in silico and in vivo datasets) (b). **p < 0.01, Normal approximation z-test](/cms/asset/5548323d-24a2-4f7e-926c-b86386a16e08/temi_a_12040052_f0006_ob.png)