
Figures & data
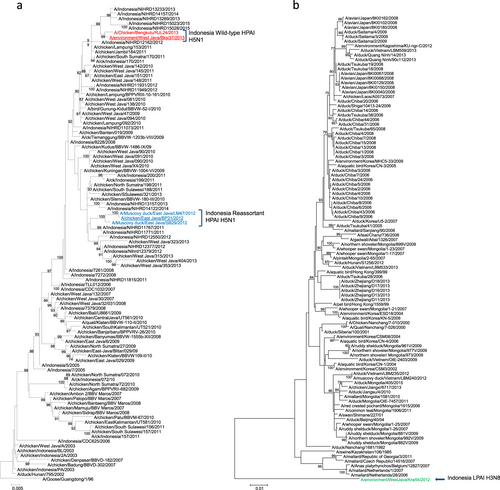
Viruses characterized herein are identified as follows: Indonesia H5N1 strain names are colored red, Indonesia reassortant H5N1 strain names are colored blue, Indonesia LPAI H3N8 strain name is colored green, and all viruses further utilized for in vivo studies are underlined. Bootstrap values calculated following 1000 replicates are shown above each branch
Genome constellations of avian influenza A viruses collected from live bird markets and human case investigations in Indonesia
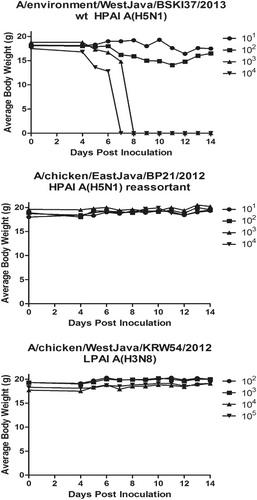
The weight for five mice per dilution was determined until day 14. The mean for each time point is displayed. In Fig. 2a, dosage groups with mice that lost ≥ 25% of their pre-inoculation body weight were humanely euthanized; this is indicated with an average body weight of zero at the next time point after this experimental endpoint was reached. Dosage was measured in EID50/ml
Infected mice were monitored for a 14 day experimental period for clinical signs of illness. Any mouse that exhibited a clinical sign of “4” or lost 25% or more of its body weight was humanely euthanized. Dosage was measure in EID50/ml. Groups of mice infected with either (b) rt HPAI A(H5N1), A/chicken/EastJava/BP21/2012 or (c) LPAI H3N8, A/chicken/WestJava/KRW54/2012 showed no mortality at any dose administered
Mouse infectivity and virulence comparison
Tissue was collected from mice 4 days post infection, homogenized, and assessed for viral recovery by plaque assay using MDCK cells. wt HPAI H5N1: A/environment/West Java/BKSI37/2013, rt HPAI H5N1: A/chicken/East Java/BP21/2012, and H3N8: (LPAI) A/environment/West Java/KRW54/2012
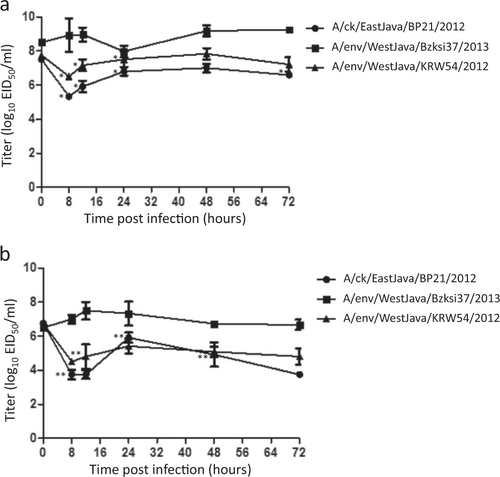
Log10 EID50/ml titers are shown as the mean (±SD) of independent experiments carried out in triplicate. Statistical variation between titers at each time point were calculated by student t-test and considered statistically significant at p = 0.01 (*) in ECEs and p = 0.25 (**) in CEFs. The wt HPAI A(H5N1) virus (A/environment/West Java/BKSI37/2013) is shown by circles, reassortant HPAI A(H5N1) virus (A/chicken/East Java/BP21/2012) by squares, and LPAI A(H3N8) virus (A/chicken/West Java/KRW54/2012) by diamonds
Molecular comparison of 2012–2013 viruses from Indonesian live bird markets