Figures & data
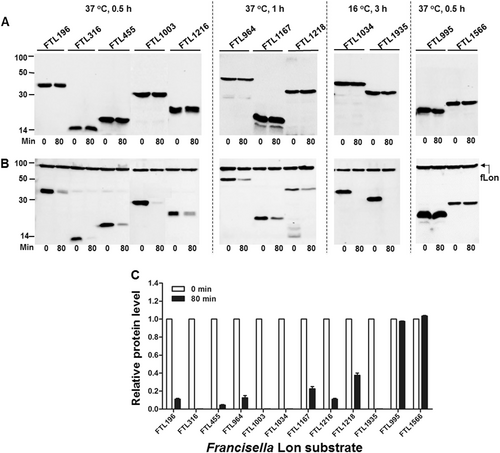
Stability of the F. tularensis proteins in the absence (a) or presence (b) of the fLon-expression plasmid in Lon-deficient E. coli ER2566. fLon was induced with arabinose for 2 h before induction of the target proteins with IPTG under the conditions specified at the top of each panel, and subsequently treatment with spectinomycin. The cells were harvested at 0 and 80 min after the addition of spectinomycin; each target protein detected by immunoblotting using the anti-His6 antibody. The sizes of protein standards are indicated at the left side in kDa. c The amount of each target protein in b was quantified by Image Lab. The level of each protein at 80 min is presented as a value relative to that at 0 min. Bars represent the mean value ± SEM (n = 3)
Each target gene in the shuttle plasmid pEDL17 was expressed with a His tag from a tetracycline-inducible promoter in LVS (open bar) or isogenic ∆lon mutant (filled bar). Proteins were detected by immunoblotting (a–h) and quantified by Image Lab (i) as in Fig. . Abundance ratio of each protein between LVS and the ∆lon mutant is indicated at the top of relevant bars. Each bars represents the mean value ± SEM (n = 3). The protein encoded by endogenous (chromosomal) FTL1017 was detected with an antiserum as a loading control
Stability of the fLon substrates was detected in the presence of fLon (a), fLonS682A (b), eLon (c), or hLon (d) in E. coli ER2566. Each set of the lon and target genes were cloned in two compatible plasmids behind either arabinose (for Lon)- or IPTG (for substrate)-inducible promoter. Protein detection and quantification were carried out as in Fig.
Stability of the eLon substrates was detected in the absence (a) or presence of eLon (b), fLon (c), or hLon (d) as in Fig.
Stability of the human Lon substrates was detected in the absence (a) or presence of hLon (b), fLon (c), or eLon (d) as in Fig.
The numbers of Lon substrate-derived peptides identified in MS
The frequencies of the 10 amino acids (AAs) preceding (position −1) and following (position +1) all cleavage sites within α-casein, RpsB, and SulA were calculated as exemplified in Fig. S7B. The small and large sizes of the letters in each position represent relatively low and high frequencies of the corresponding amino acids, respectively. The AAs are presented as nonpolar and aliphatic group (black), polar and uncharged group (green), positively charged group (blue), or negatively charged group (red)
Recombinant HUβ (15 µg) was incubated at 37 °C with the Lon protease (10 µg) of E. coli (eLon) or human (hLon) before (a) or after (b) being denatured by heat. The proteins in the reactions were detected by SDS-PAGE and Coomassie Brilliant staining at 0, 6, and 12 h. Creatine kinase (CK) presented in the reaction mixture was used for ATP regeneration in this assay. HUβ was quantified by Image Lab and presented as relative value to the sample taken at 0 h (left panel of a and b). Sites of peptide bond break in HUβ in the presence of eLon (top panel) or hLon (middle), or in the absence of Lon protease (bottom) were identified by detection of peptides in the samples taken at 6 h by mass spectrometry (c). The arrows above the gaps of adjacent amino acids indicate the ends of individual peptides
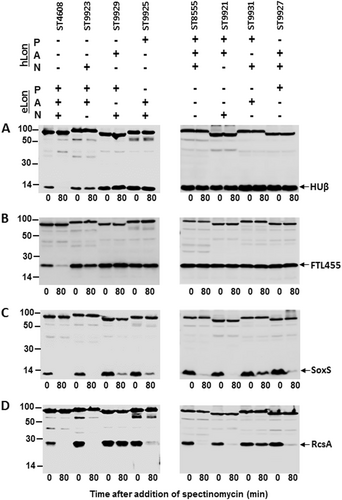
Stability of HUβ (a), FTL455 (b), SoxS (c), and RcsA (d) was detected in the presence of the domain swap mutants between eLon and hLon as illustrated in Fig. S5