Figures & data
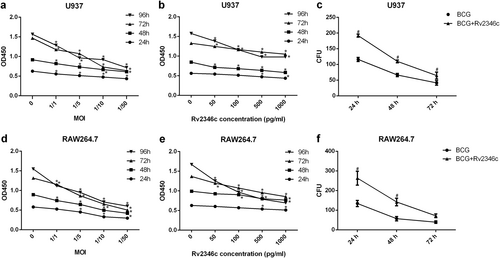
U937 and RAW264.7 cells were treated with BCG at the indicated MOI or BCG (MOI 1/5) together with the recombinant Rv2346c protein for 24, 48, 72, or 96 h. A CCK-8 assay was performed to estimate cell proliferation (a, b, d, e). Cells were also infected with BCG (MOI 1/5) with or without the recombinant Rv2346c protein (500 pg/ml) treatment for the indicated time, and a CFU assay was performed to assay BCG survival (c, f). All the presented graphs are representative of three independent experiments. Data are presented as the means ± SD. *P < 0.05 vs. control group. #P < 0.05 vs. BCG group of the same infection time
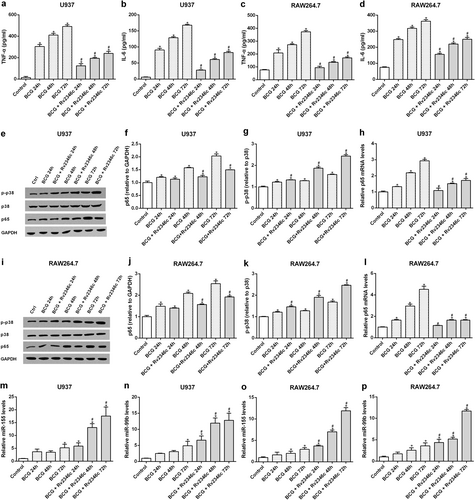
U937 and RAW264.7 cells were infected with BCG (MOI 1/5) and cells in the BCG + Rv2346c groups were also treated with Rv2346c (500 pg/ml). After incubating for 24, 48, or 72 h, cell culture supernatants were collected and examined using ELISA assay (a–d); total protein was extracted and estimated via western blot (e, f, g, i, j, k); total RNA was extracted and analyzed via qRT-PCR (h, l, m–p). GAPDH and p38 were used as loading controls for protein expression analysis. Protein bands were scanned and the intensity was determined. The results are representative of three independent experiments. Data are presented as the means ± SD. *P < 0.05 vs. control group; #P < 0.05 vs. BCG group of the same infection time
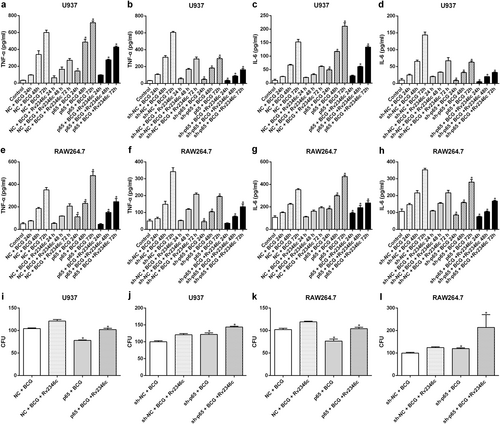
U937 and RAW264.7 cells were transfected with a control vector (indicated with NC), a p65 overexpression vector (indicated with p65), a nonspecific siRNA (indicated with sh-NC) or a specific siRNA directed against p65 (indicated with sh-p65). After 24 h post transfection, cells were infected with BCG (MOI 1/5) and cells in the BCG + Rv2346c group were also treated with Rv2346c (500 pg/ml). Cell culture supernatants were collected and detected with ELISA after incubating for 24, 48, or 72 h (a–h). BCG survival was evaluated by a CFU assay after incubating for 24 h (i–l). The results are representative of three independent experiments. Data are presented as the means ± SD. *P < 0.05 vs. the control vector or the nonspecific siRNA interference group of the same treatment
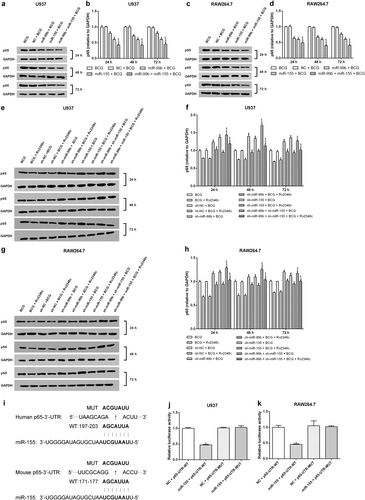
U937 and RAW264.7 cells were transfected with a negative control miRNA mimic (indicated with NC), miR-155, or miR-99b mimics, both miR-155 and miR-99b mimics, a negative control miRNA inhibitor (indicated with sh-NC), a miR-155 inhibitor (indicated with sh-miR-155), a miR-99b inhibitor (indicated with sh-miR-99b), or both the miR-99b and miR-155 inhibitors. After 24 h post transfection, cells were infected with BCG (MOI 1/5) and cells in the BCG + Rv2346c group were also treated with Rv2346c (500 pg/ml). After incubating for 24, 48, or 72 h, cells were collected to extract total protein. The protein expression was detected via western blotting. The results are representative of three independent experiments. Data are presented as the means ± SD. *P < 0.05 vs. a negative control (NC group or sh-NC group) + BCG group (with or without Rv2346c treatment); &P < 0.05 vs. miR-99b or sh-miR-99b + BCG group (with or without Rv2346c treatment); $P < 0.05 vs. miR-155 or sh-miR-155 + BCG group (with or without Rv2346c treatment) (a–h). Sequence alignment of miR-155 and its conserved target site in the P65-UTR is shown (i). Luciferase activity was measured in U937 and RAW264.7 cells with a dual-luciferase reporter assay. The cells were co-transfected with a plasmid expressing miR-155 mimic or a control miRNA (indicated with NC) and a vector expressing P65-UTR WT or P65-UTR MUT. Firefly luciferase activity was normalized to Renilla luciferase activity. The results are representative of three independent experiments. Data are presented as the means ± SD. * P < 0.05 vs. NC + P65-UTR-WT group (j, k)
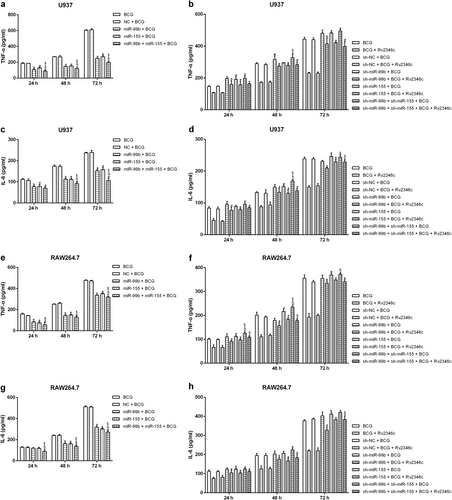
U937 and RAW264.7 cells were transfected with a negative control miRNA for mimic (indicated with NC), miR-155, or miR-99b mimics, both miR-155 and miR-99b mimics, a negative control miRNA inhibitor (indicated with sh-NC), a miR-155 inhibitor (indicated with sh-miR-155), a miR-99b inhibitor (indicated with sh-miR-99b), or both the miR-155 and miR-99b inhibitors. After 24 h post transfection, cells were infected with BCG (MOI 1/5) and cells in the BCG + Rv2346c group were also treated with Rv2346c (500 pg/ml). After incubating for 24, 48, or 72 h, cell culture supernatants were collected and detected with ELISA assay. The results are representative of three independent experiments. Data are presented as the means ± SD. *P < 0.05 vs. the negative control (NC group or sh-NC group) + BCG group (with or without Rv2346c treatment); &P < 0.05 vs. miR-99b/sh-miR-99b + BCG group (with or without Rv2346c treatment); $P < 0.05 vs. miR-155/sh-miR-155 + BCG group (with or without Rv2346c treatment)
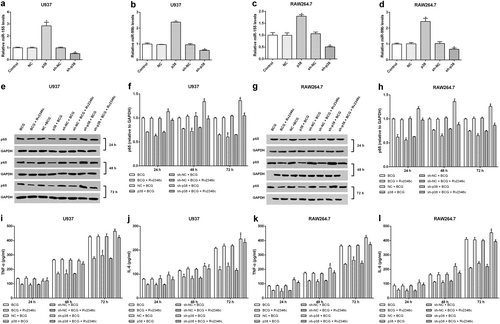
U937 and RAW264.7 cells were transfected with a control vector (indicated with NC), pcDNA3.1/p38 cDNA (indicated with p38), a nonspecific siRNA (indicated with sh-NC) or a specific siRNA directed against p38 (indicated with sh-p38). After 24 h post transfection, total RNA was extracted. miR-155 and miR-99b were detected via qRT-PCR. The results are representative of three independent experiments. Data are presented as the means ± SD. * P < 0.05 vs. the negative control (NC group or sh-NC group) (a–d). After 24 h post transfection, cells were infected with BCG (MOI 1/5) and cells in the BCG + Rv2346c group were also treated with Rv2346c (500 pg/ml). After incubating for 24, 48, or 72 h, total protein was extracted and cell culture supernatants were collected. Protein expression was detected via western blotting (e–h). The cytokines were detected via ELISA assay (i–l). The results are representative of three independent experiments. Data are presented as the means ± SD. *P < 0.05 vs. the negative control (NC group or sh-NC group) + BCG group (with or without Rv2346c treatment)
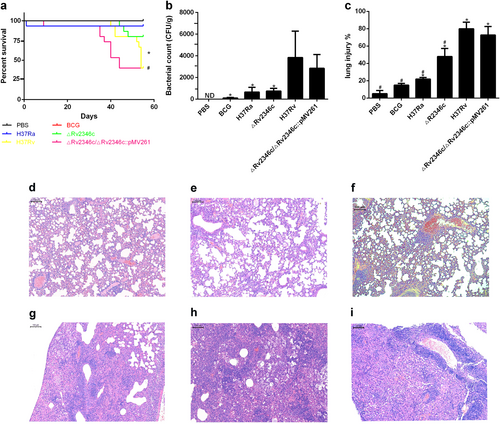
C57BL/6 mice were intratracheally infected with BCG, H37Ra, ΔRv2346c, H37Rv, or ΔRv2346c/ΔRv2346c::pMV261. Survival was monitored until 55 dpi. * P < 0.05 ΔRv2346c group vs. H37Rv group, #P < 0.05 ΔRv2346c group vs. ΔRv2346c/ΔRv2346c::pMV261 group (a). Lungs were collected at 35 dpi and used for a CFU assay or H&E staining. CFUs were normalized to grams of the lung tissue. *P < 0.05 vs. H37Rv group (b). Morphometric analysis of the total lesion was performed on H&E-stained sections of lung tissues. Scale bar represents 100 μm (d–i). Histograms show the mean percentage of lesion area within the total lung. *P < 0.05 vs. PBS group, #P < 0.05 vs. H37Rv group (c). In the survival assay, 15 mice were used for each group; the CFU results are representative of five independent experiments; the lung injury results are representative of three independent experiments. Data are presented as the means ± SD. d PBS; e BCG; f H37Ra; g ΔRv2346c; h H37Rv; i ΔRv2346c/ΔRv2346c::pMV261. dpi days post infection, ND not determined
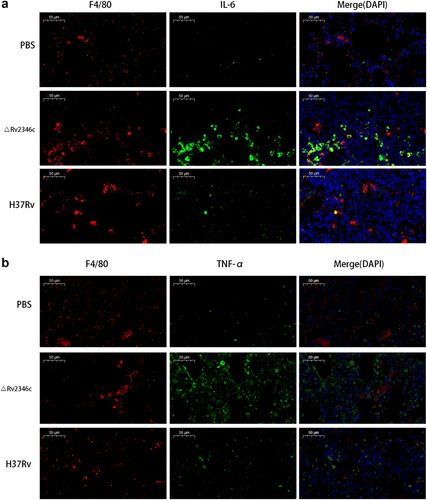
C57BL/6 mice were intratracheally infected with ΔRv2346c or H37Rv. Lungs were collected at 35 dpi and used for immunofluorescence staining. All macrophages are indicated in red; IL-6 and TNF-α in green; nuclei in blue (DAPI). Scale bar represents 50 μm. dpi days post infection