Figures & data
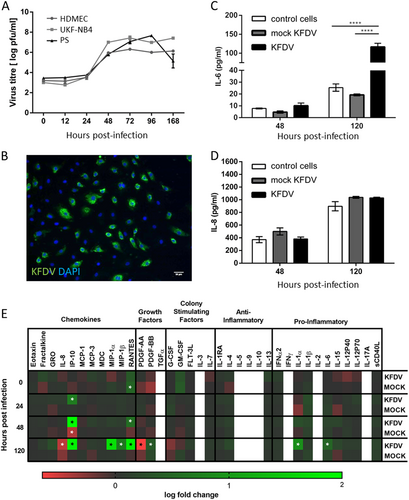
a HDMECs, PS, and UKF-NB4 cells were infected with KFDV at an MOI of 10. At the indicated time points, supernatants from the infected cells were collected, and KFDV titers were measured by plaque assay. b KFDV-infected and mock-infected HDMECs grown on slides were fixed at 48 h p.i. and immunostained with flavivirus E protein–recognizing antibody (green) and counterstained with DAPI (blue). c, d Supernatants from KFDV-infected, uninfected and mock-infected (UV-inactivated virus) HDMECs were collected at 48 and 120 h p.i., and levels of IL-6 and IL-8 were determined by ELISA. Data represent the mean concentrations ± SEM. ***p < 0.001. e Supernatants from KFDV-infected, uninfected and mock-infected (UV-inactivated virus) HDMECs were collected at 0, 24, 48 and 120 h p.i., and levels of multiple cytokines, chemokines and growth factors were determined by the Milliplex 41-plex human cytokine/chemokine magnetic bead panel assay. “Discoveries” as described in the Material and Methods are marked by an asterisk
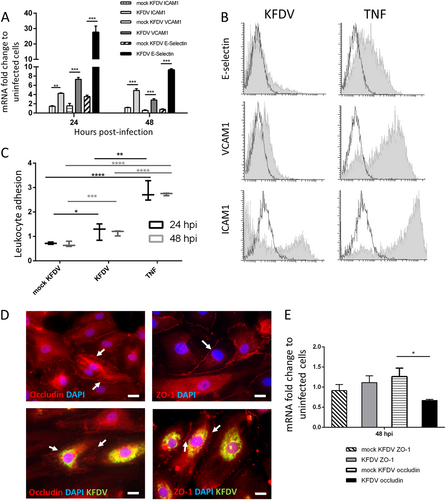
a HDMECs were infected with KFDV at an MOI of 10. Mock-infected HDMECs were exposed to the same dose of UV-inactivated KFDV. At 24 and 48 h p.i., mRNA expression of E-selectin, ICAM1, and VCAM1 was analyzed by qRT-PCR and normalized to the expression of housekeeping genes. Fold increase indicates differences in normalized mRNA expression relative to expression in noninfected cells. b Flow cytometry was used to measure the protein levels of E-selectin, VCAM1, and ICAM1 expression in the KFDV-infected HDMECs at 48 h p.i. The production of cell-adhesion molecules is shown in overlapping histograms of relative fluoresce intensity in the analyzed cells; empty histograms with solid lines represent mock-infected (UV-inactivated virus) HDMECs, and gray histograms represent the KFDV-infected cells. c HDMECs were treated with TNF-α (positive control) or mock-infected with UV-inactivated KFDV or infected with KFDV at an MOI of 10 and incubated for 24 and 48 h. After incubation, the adhesion of BCECF–stained leukocytes was measured as described in the Materials and Methods. The leukocyte adhesion index represents the fold change relative to controls (y-axis). d HDMECs grown and fixed on slides at 48 h p.i. were stained with anti-flavivirus envelope (green) and anti-occludin (red) or anti-ZO-1 antibodies and counterstained with DAPI (blue). Bar = 20 µm. e Total RNA from uninfected, mock- and KFDV-infected HDMECs 48 h p.i. was used to determine the fold change in occludin and ZO-1 mRNA expression by qRT-PCR. *p < 0.05; **p < 0.01; ***p < 0.001; ****p < 0.0001. h.p.i. = hours post infection
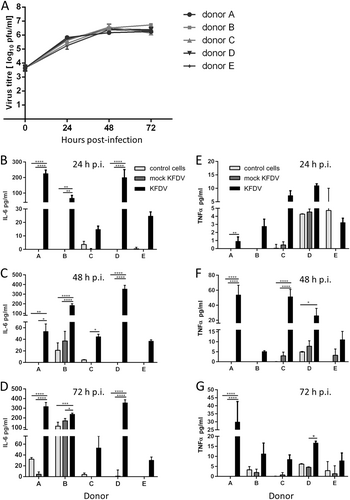
a PBMCs were obtained from buffy coats from 5 healthy and naïve donors (a–e). Monocytes were purified from PBMCs by positive magnetic separation. MoDCs were obtained and infected with KFDV as described in the Materials and Methods, and viral growth was quantified in cell culture supernatants at 0, 24, 48, and 72 h p.i. using the plaque assay. b–d Supernatants from uninfected (control), KFDV-infected and mock-infected (UV-inactivated virus) moDCs were collected at 24 (b), 48 (c), and 72 (d) h p.i., and levels of IL-6 were determined by ELISA. e–g Supernatants from KFDV-infected and mock-infected (UV-inactivated virus) moDCs were collected at 24 (b), 48 (c), and 72 (d) h.p.i., and levels of TNF-α were determined by ELISA. Data represent mean concentrations ± SEM. *p < 0.05; **p < 0.01; ***p < 0.001; ****p < 0.0001
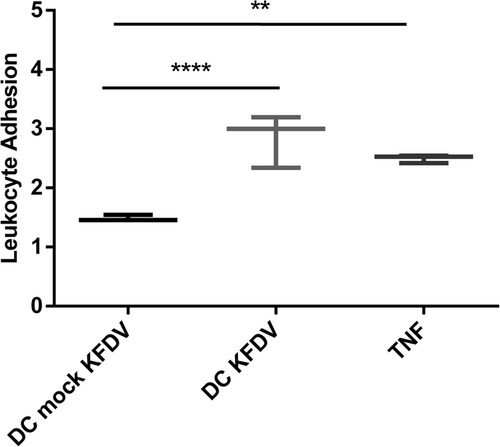
Supernatants from the moDCs infected with KFDV or mock-infected with UV-inactivated virus for 48 h were collected and incubated with monolayers of HDMECs for 6 h. After incubation, the leukocyte adhesion assay was performed as described in the Materials and Methods. HDMECs treated with TNF-α were used as a positive control. The level of leukocyte adhesion was normalized against leukocyte adhesion in untreated and uninfected HDMECs and is expressed as the leukocyte adhesion index representing the fold change relative to controls. The data are represented by a boxplot with minimal and maximal values. **p < 0.01; ****p < 0.0001