Figures & data
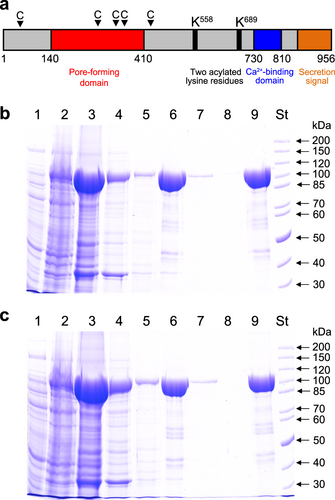
a Scheme of the K. kingae RtxA molecule, with several different areas predicted from homology with other RTX toxins. The arrowheads with a letter C indicate the predicted CRAC and CARC motifs. The RtxA (b) and proRtxA (c) proteins were produced in E. coli BL21/pMM100 cells and purified by a combination of affinity and hydrophobic chromatographies. Lanes: 1, crude extract from uninduced cells; 2, crude extract from cells induced with isopropyl β-D-1-thiogalactopyranoside (IPTG) to produce RtxA/proRtxA; 3, clarified crude urea extract from induced cells; 4, Ni-NTA agarose column flowthrough; 5, Ni-NTA agarose column wash; 6, fraction of eluted 105-kDa RtxA/proRtxA; 7, phenyl-sepharose column flowthrough; 8, phenyl-sepharose column wash; 9, fraction of eluted RtxA/proRtxA; and St, molecular-mass standards. The samples were analyzed on 7.5% polyacrylamide gels and stained with Coomassie blue
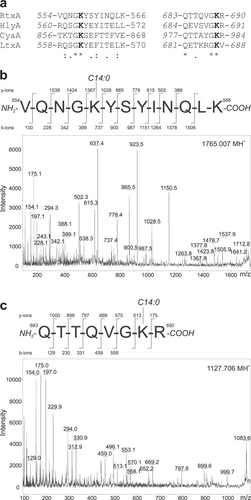
a ClustalW sequence alignment of putative acylated sites of RtxA and corresponding sequences of related RTX toxins whose post-translational modification through amide-linked fatty acylation on the ε-amino group of two conserved internal lysine residues was previously demonstrated:Citation22, Citation23, Citation25, Citation26 RtxA, K. kingae isolate PYKK081 cytotoxin; HlyA, E. coli α-hemolysin (UniProt code: Q8G9Z4); CyaA, B. pertussis adenylate cyclase toxin (UniProt code: P0DKX7); LtxA, A. actinomycetemcomitans leukotoxin (UniProt code: P16462). The highly conserved lysine residues (K558 and K689 in RtxA) that have been shown to be acylated in HlyA, CyaA and LtxA are shown in bold. Symbols: (*) identity; (:) strongly similar; (.) weakly similar. b, c The tryptic fragments with m/z signals 1099.675, 1127.706, 1143.699, 1153.723, 1765.007 and 1781.003, which were exclusively present in trypsin-digested RtxA (Supplementary Fig. 1), were further analyzed using a tandem MS/MS sequencing approach. b The MS/MS spectrum of the peptide 1765.007 contains b- and y-ions that correspond to the sequence 554-VQNGKYSYINQLK-566 with the ε-amino group of K558 modified by a myristoyl (C14:0) acyl chain. c The MS/MS spectrum of the peptide 1127.706 contains b- and y-ions that correspond to the sequence 683-QTTQVGKR-690 with a myristoyl (C14:0) acyl group attached to the ε-amino group of K689. The MS/MS spectra of the remaining unexpected peptides (1099.675, 1143.699, 1153.723 and 1781.003) are shown in Supplementary Fig. 2. The residue numbering corresponds to that of the full-length sequence of the RtxA variant from the K. kingae isolate PYKK081
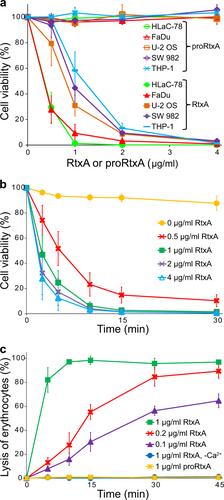
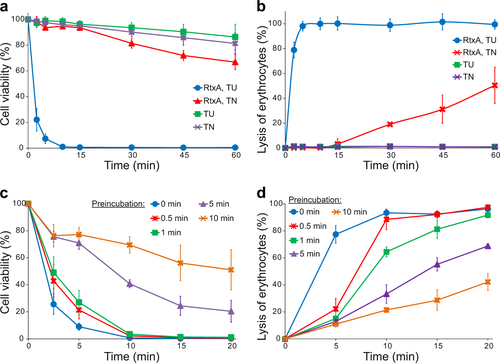
a Different cell types (1 × 10⁶/ml) were incubated with increasing concentrations (0.5, 1, 2, and 4 µg/ml) of purified RtxA or proRtxA in the presence of 2 mM calcium ions for 1 h at 37 °C. b HLaC-78 cells (1 × 10⁶/ml) were incubated with the indicated concentrations of purified RtxA for different times at 37 °C. a, b Cell viability was determined by a cell viability staining assay using 1 µg/ml of Hoechst 33258 followed by flow cytometry. The viability of cells incubated without RtxA was reported as 100%. Each point represents the mean value ± SD of four independent experiments. c Erythrocytes (5 × 10⁸/ml) were incubated at 37 °C in the presence of increasing concentrations (0.1, 0.2, and 1 µg/ml) of purified RtxA or 1 µg/ml of proRtxA. Erythrocytes incubated with 1 µg/ml of RtxA in the absence of calcium ions were used as negative control. Cytolytic (hemolytic) activity was measured at different times as the amount of released hemoglobin by photometric determination (A541nm). Complete lysis of erythrocytes was reported as 100%. Each point represents the mean value ± SD of three independent determinations performed in duplicate
a, b RtxA purified under denaturing conditions (50 mM Tri-HCl and 8 M urea; RtxA, TU) and RtxA purified under native conditions (50 mM Tris-HCl and 150 mM NaCl; RtxA, TN) were diluted 100-fold into HLaC-78 cells (1 × 10⁶/ml) (a) and erythrocytes (5 × 10⁸/ml) (b) to a final concentration of 2 µg/ml. TU and TN buffers without RtxA were used as negative controls. Cells were incubated for different times at 37 °C and analyzed as described in the Fig. legend. Each point represents the mean value ± SD of four independent experiments. c, d RtxA purified under denaturing conditions was diluted 100-fold with TN buffer to concentrations of 2 and 0.5 µg/ml, respectively. The toxin samples were preincubated for different times (0, 0.5, 1, 5, and 10 min) at 37 °C and were subsequently added to pelleted HLaC-78 cells (1 × 10⁶/ml; from 2 µg/ml RtxA samples) (c) and erythrocytes (5 × 10⁸/ml; from 0.5 µg/ml RtxA samples) (d). The cells were incubated for different times at 37 °C and analyzed as described in the Fig. legend. Each point represents the mean value ± SD of four independent experiments (c) or three independent determinations performed in duplicate (d)
a Representative single-pore recordings of asolectin/decane:butanol (9:1) membranes in the presence of 1 nM purified recombinant RtxA and proRtxA. The aqueous phase contained 150 mM KCl, 10 mM Tris-HCl (pH 7.4), 2 mM CaCl2; the applied voltage was 50 mV; the temperature was 25 °C and the recording was filtered at 10 Hz. The numbers above the recordings represent lifetimes. b Kernel density estimation (KDE) of single-pore conductances of RtxA and proRtxA (>500 events) were calculated from single-pore recordings acquired on several different asolectin membranes under the same conditions as in (a). The results are summarized in Table , and the numbers in each KDE represent the most frequent values of three well-distinguishable single-pore conductance states. c For lifetime determination, approximately 400 individual pore openings were recorded on several different asolectin membranes with 0.25, 0.5, and 1 nM RtxA or proRtxA (all other parameters were the same as in (a)), and the KDE of dwell times was fitted with a double-exponential function. The error estimates of lifetimes were obtained by bootstrap analysis. The results are summarized in Table , and the numbers in each graph represent the most frequent values of two well-distinguishable lifetimes. d Overall membrane activity of the purified RtxA and proRtxA proteins on asolectin/decane:butanol (9:1) membranes using the same conditions as in (a)
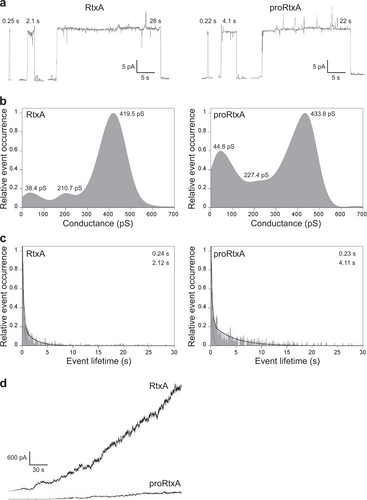
Activities of RtxA and proRtxA on planar lipid membranes
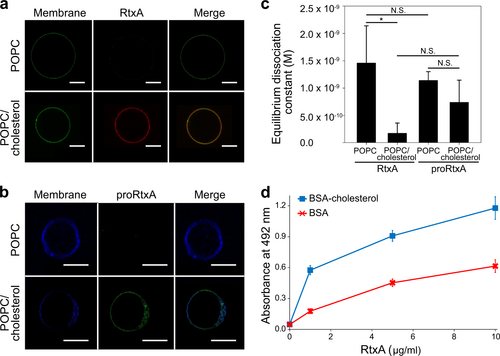
a RtxA labeled with AF555 (red) was incubated with GUVs composed of either 100% POPC or 75% POPC and 25% cholesterol, labeled with NBD-PE (green) for 30 min. b proRtxA labeled with Dy495 (green) was incubated with GUVs composed of either 100% POPC or 75% POPC and 25% cholesterol, labeled with Marina Blue (blue) for 30 min. c RtxA and proRtxA binding to POPC and POPC/cholesterol membranes was analyzed by SPR. The equilibrium dissociation constant (KD) was measured for RtxA and proRtxA binding to 100% POPC or 75% POPC and 25% cholesterol membranes by determining the association and dissociation rate constants of each interaction (Supplementary Table 4). *p < 0.05; N.S., not significant. d Wells of a 96-well plate were coated with 10 μg/ml of cholesterol-BSA or free BSA, which were subsequently incubated with different concentrations of purified RtxA that was detected with the mAb 9D4. Each point represents the mean value ± SD of three independent determinations performed in duplicate
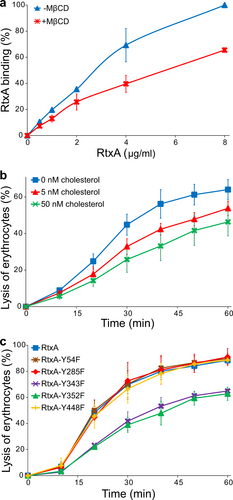
a Erythrocytes (5 × 10⁸/ml) were pretreated with 1 mM MβCD at 37 °C for 30 min, diluted to 1 × 10⁷/ml and placed on ice before RtxA labeled with Dy495 was added at the indicated concentrations. The cells were incubated with the toxin for 15 min at 4 °C, and the amount of fluorescently labeled RtxA bound was determined by flow cytometry. The results are expressed as the relative binding of RtxA according to the following formula: relative binding = (sample binding)/(maximum binding) × 100. The data shown are the mean values ± SD of four independent experiments. b Purified RtxA (1 µg/ml) was preincubated for 10 min at room temperature in the presence (5 and 50 nM) or absence of cholesterol and then was added to erythrocytes (5 × 10⁸/ml). The cells were incubated for different times at 37 °C and analyzed as described in the Fig. legend. Each point represents the mean value ± SD of three independent determinations performed in duplicate. c Substitutions of the tyrosine residues Y343 and Y352 by phenylalanine residues in the putative CARC/CRAC motifs reduce the cytolytic activity of RtxA. Erythrocytes (5 × 10⁸/ml) were incubated with 100 ng/ml of intact RtxA or its mutant variants for different times at 37 °C and analyzed as described in the Fig. legend. The data shown are the mean values ± SD of three independent experiments