Figures & data
Number of avian influenza viruses (AIVs) isolated from wild birds in the Republic of Korea between 2010 and March 2017
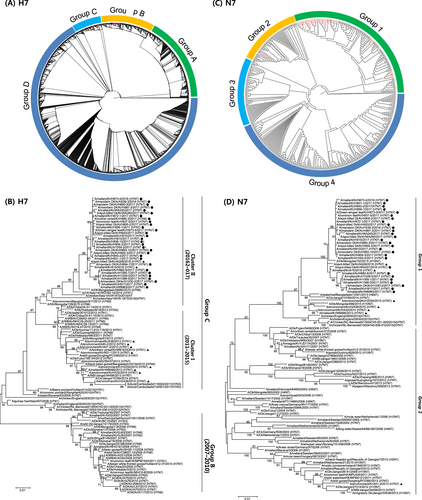
a Phylogenetic tree of the HA genes of 41 H7 influenza A viruses, representative of 107 viruses isolated in the Republic of Korea between 2010 and 2017 (red lines), in addition to all 2963 H7 sequence >1600 nt from viruses isolated in Eurasia that were available from the Global Initiative on Sharing All Influenza Data (GISAID). Evolutionary analyses were conducted in RAxML. Red lines denote the H7 viruses isolated in South Korea. b Maximum-likelihood phylogenetic tree of a subset of group B and C H7 genes. Tree stability was determined by bootstrap analysis with 1000 replicates, and bootstrap values >70% are displayed above the branch nodes. Evolutionary analyses were conducted in MEGA6. For the H7 viruses isolated in the Republic of Korea in this study, those isolated during 2016–2017 are indicated by dots, and those isolated at other times are indicated by triangles. Other viral sequences were obtained from GISAID. Ck chicken, Dk duck, Kr Korea, WBF wild bird feces. c Phylogenetic tree of NA genes of 33 H7N7 influenza A viruses isolated in the Republic of Korea between 2010 and 2017 (red lines) and all 505 N7 sequences >1400 nt from viruses isolated in Eurasia that were available from GISAID. Evolutionary analyses were conducted in RAxML. d Maximum likelihood phylogenetic tree of a subset of group 1 and 2 N7 genes. Tree stability was determined by bootstrap analysis with 1000 replicates, and bootstrap values >70% are displayed above the branch nodes. Evolutionary analyses were conducted in MEGA6. For the H7 viruses isolated in the Republic of Korea in this study, those isolated during 2016–2017 are indicated by dots, and those isolated at other times are indicated by triangles. Other viral sequences were obtained from GISAID. Ck chicken, Dk duck, Kr Korea, WBF wild bird feces
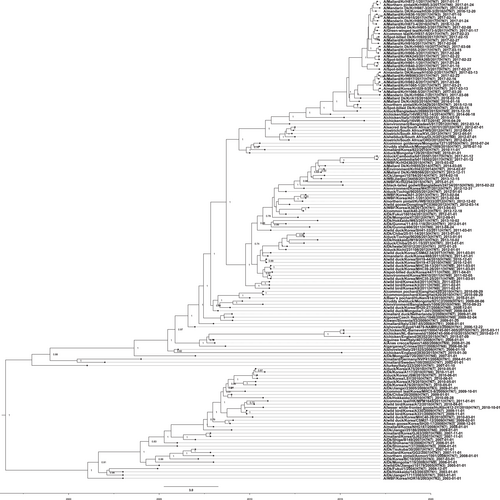
An HA nucleotide-sequence phylogeny was inferred using the SRD06 partitioned-substitution model, an uncorrelated lognormal relaxed clock, and a Bayesian skyline coalescent model in BEAST v1.8.1 with a chain length of 100 million. A genome-constellation analysis was performed by generating gene clusters for each segment using a 97% nucleotide identity cutoff. Cluster assignments are represented by one colored box for each gene segment, creating a genome constellation for each virus. Coloring between the columns is independent, and the total number of colors in a column reflects the number of clusters generated for that gene segment. Ck chicken, Dk duck, Kr Korea, WBF wild bird feces
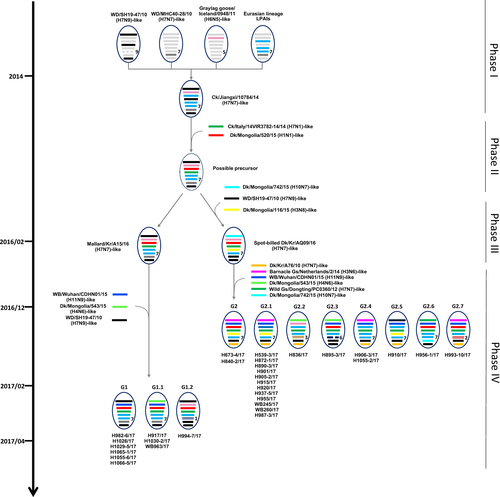
Influenza A viruses are represented by ovals containing horizontal bars for the eight gene segments (from top to bottom, PB2, PB1, PA, HA, NP, NA, MP, and NS). Different colors represent different viral lineages. Solid ovals represent virus strains isolated from wild and domestic birds, and dotted ovals represent hypothetical viral strains. The timescale is indicated on the left side, and the different phases of evolution are indicated on the right side. The labels below the viral ovals are identifiers for corresponding viruses isolated in this study. Ck chicken, Dk duck, Kr Korea, WBF wild bird feces, Gs goose
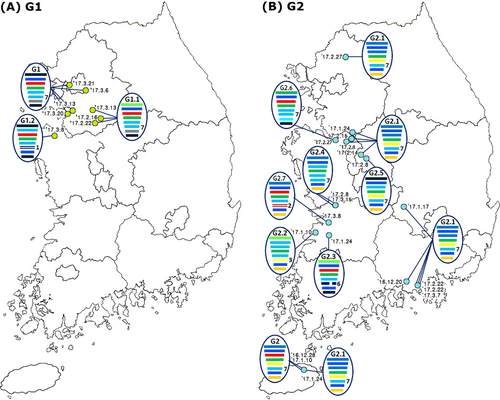
The light green and blue circles indicate the locations where the G1 (a) and G2 (b) subgroups of the H7 LPIAVs were isolated from wild bird habitats, and the associated collection dates are indicated. The IAVs are represented by ovals containing horizontal bars for the eight gene segments (from top to bottom, PB2, PB1, PA, HA, NP, NA, MP, and NS). The different colors represent different virus lineages. Genotypes G1 and G2 were subgroups within cluster II of group C of H7 LPIAVs
Replication and transmission of representative H7N7 viruses in 4-week-old specific-pathogen-free chickens
Virus titers in tissues from 4-week-old specific-pathogen-free chickens challenged with representative H7N7 isolates
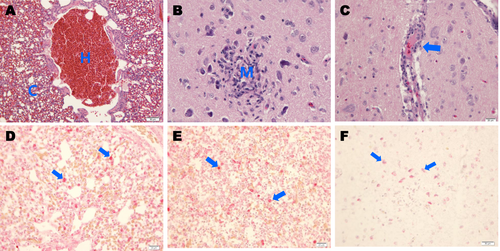
Photomicrographs of hematoxylin and eosin (H&E)-stained and immunohistochemically stained tissue sections collected 4 days postinfection from chickens challenged with A/mandarin duck/Korea/H539-3/2016 (H7N7) virus. a Chickens challenged with the H7N7 virus showing severe hemorrhaging (h) and congestion (c) in lung tissue (H&E stain). b Infected chickens showing focal necrosis and mononuclear-cell infiltration (m) in cerebral tissue (H&E stain). c Infected chickens showing mild perivascular cuffing (arrow) in cerebral tissue (H&E stain). d IAV NP antigens were immunostained in alveolar macrophages (arrows) in lung tissue. e IAV antigens were immunostained in macrophages of red pulp (arrows) in spleen tissue. f IAV antigens were immunostained in cerebral tissue neurons (arrows)