
Figures & data
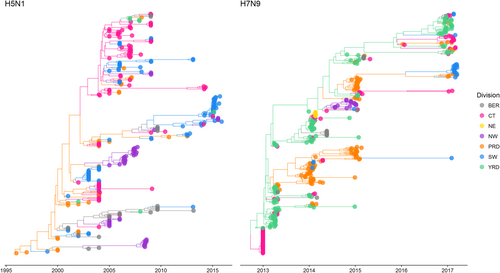
Bayesian MCC phylogeneies and between-region diffusion networks on HA gene segments of H5N1 (left panel) and H7N9 (right panel) in China. The sequences are classified according to their location grouped by economic division. Bohai Economic Rim (BER): Beijing, Hebei, Shandong; Central (CT): Anhui, Henan, Hubei, Hunan, Jiangxi, Shanxi; North-east (NE): Heilongjiang, Jilin, Liaoning; North-west (NW): Gansu, Ningxia, Qinghai, Shaanxi, Xinjiang; Pan-Pearl River Delta (PRD): Fujian, Guangdong; South-west (SW): Guangxi, Guizhou, Sichuan, Tibet, Yunnan, Chongqing; Yangtze-River Delta (YRD): Jiangsu, Shanghai, Zhejiang. Trees have been scaled according to taxa dates (representing sample collection date)
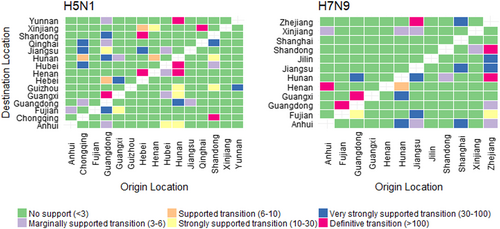
The left and right panels display the level of Bayes Factor (BF) support for each of the transmission routes considered for H5N1 and H7N9 analyses respectively. The x-axis represents the origin location and the y-axis represents the destination. Level of BF support is coloured according to classifications described in Table S1.
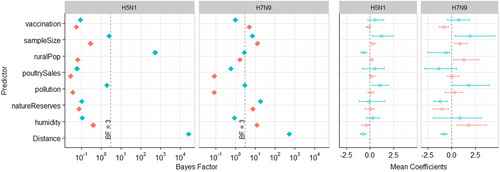
From left to right, the two panels show (i) Bayes Factor (BF), and (ii) Mean Coefficients (meanCeffects) and their 95% highest posterior credible intervals. Plots for H5N1 and H7N9 are displayed side by side. For all predictors excluding Distance, green and orange colours represent origin and destination locations respectively. In the BF plots, the dashed line indicates BF = 3. In the meanCeffects plot, the dashed line indicates 0. Note BF results are displayed on a log10 scale
Potential predictors collated for generalised linear model (GLM) analysis