Figures & data
a No filamentous colonies observed before passaging the animal. C. auris cells were grown on YPD medium for 2 days at 30 °C and then switched to 25 °C for five additional days. No filamentous colonies were observed (switching frequency < 0.001%). b Passage through the animal induces the filamentous morphology. C. auris cells were injected into mouse tail veins; cells were recovered from liver, kidney, brain, lung, and spleen tissues 24 h postinfection and replated on YPD medium. After 2 days of incubation at 30 °C, the cultures were then transferred to 25 °C for five additional days of incubation. Colonies shown were recovered from the liver and characterized as: smooth/typical yeast (S) or filamentous (F). Switching frequencies of typical yeast to filamentous colonies were (0.1 ± 0.2)% in the liver (colonies shown in the figure) and (0.4 ± 0.2)% in the kidney, respectively (totally, about 4000 colonies were analyzed). Scale bar represents 10 μm. c Scanning electron microscope (SEM) images of typical yeast and filamentous C. auris cells. C. auris cells were grown on YPD medium at 37 °C for 3 days and then switched at 25°C for three additional days of incubation. Scale bar represents 5 μm
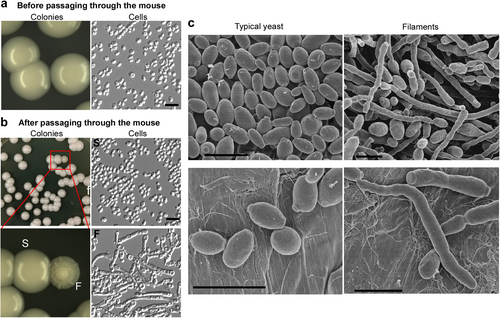
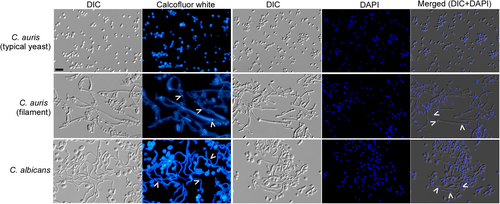
C. auris cells were grown on YPD medium at 37 °C for 3 days and then transferred at 25 °C for three additional days of incubation. C. albicans cells were grown in liquid YPD plus 10% serum medium at 37 °C for 6 h and collected for staining assays. White arrows indicate septin rings and nuclei. Scale bar represents 10 μm
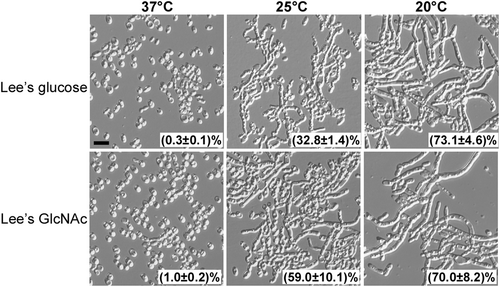
Filamentous cells were plated on Lee’s glucose and Lee’s GlcNAc media for 7 days of growth at 37, 25, or 20 °C. Cellular morphology of representative colonies was examined. Percentage of filamentous cells are indicated. Approximately 1500–2000 cells were examined for each culture. Scale bar represents 10 μm
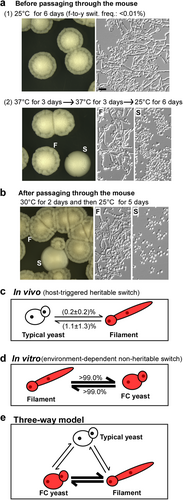
a Morphologies without passage through the mouse: (1) filamentous cells were plated on YPD medium for 6 days of growth at 25 °C (no switching to the typical yeast colonies were observed, f-to-y swit. frequency < 0.01%); (2) filamentous cells were grown on YPD medium at 37 °C for 3 days, replated, and grown at 37 °C for three additional days before being replated and grown at 25 °C for 6 days (switching frequency from filamentous-to-typical yeast colonies was 1.2 ± 0.2%). b Morphologies after passage through the mouse. Filamentous cells were injected into the mouse via the tail vein. Cells recovered from tissues were grown on YPD medium at 30 °C for 2 days and then transferred at 25 °C for 5 days of incubation. Colonies shown were recovered from kidney tissues and classified as smooth (S, typical yeast) or filamentous (F). c In vivo model. Typical yeast-filament switching frequencies represent the average percentages of colonies with an alternative phenotype after passage through the animal and replating and culturing on YPD medium at 25 °C. These host-triggered switches are rare and heritable. d In vitro FC yeast-filament switches. FC yeast designation indicates a filamentation-competent form of C. auris, an intermediate cell type capable of returning from a morphologically yeast phenotype to a filamentous form following exposure to 25 °C growth conditions. The frequency of the FC yeast-to-filament switch is higher than 99% at 25 °C and the frequency of the filament-to-FC yeast switch is higher 99% at 37 °C (~1000 colonies were analyzed for each switch). Therefore, the morphological switches between the FC yeast and filamentous forms are temperature-dependent and nonheritable. e The typical yeast, FC yeast, and filamentous cell types form a three-way switching system that combines a heritable (typical yeast-to-FC yeast/filamentous) and a nonheritable (FC yeast-to-filamentous) switch. Thin and thick lines indicate low and high switching frequencies, respectively
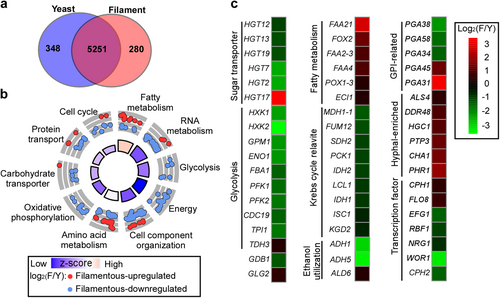
a Venn diagram depicting differentially expressed genes. A twofold difference cut off and false discovery rates (FDRs) less than 0.05 were used to define differentially expressed genes. b GO enrichment analysis of differentially expressed genes was conducted. Red or blue circles represent upregulated or downregulated genes in filamentous cells, respectively. The inner cycle bars represent statistical significance. c R package heatmap was used to depict selected differentially expressed genes. Functional categories of genes are indicated. Log2(F/Y), Log2 (read counts of filamentous cells/read counts of yeast cells)
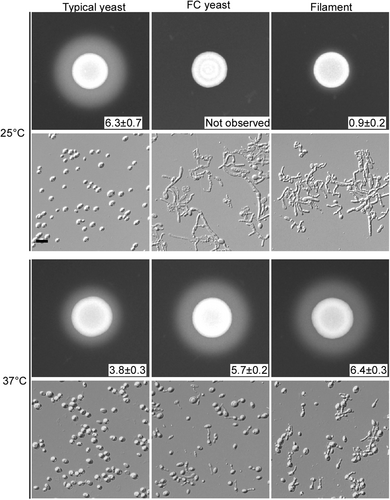
Cells were spotted on YCB-BSA medium (5 × 10⁶ cells) and grown at 25 or 37 °C for 5 days. The width of the white precipitation zone (mm) is reported. Cellular morphologies after 5 days of growth are also shown. Scale bar represents 10 μm
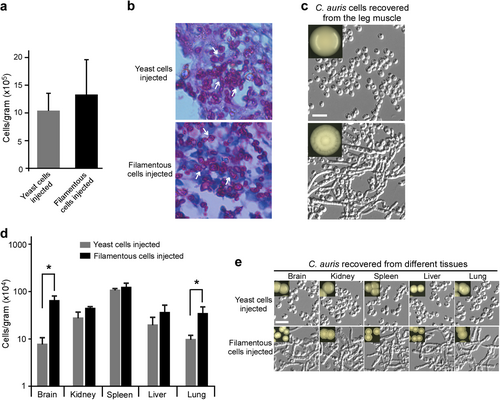
a Fungal burdens were determined using excised leg muscle samples. Mice were injected with typical yeast or filamentous cells intraperitoneally. After 24 h of infection, mice were euthanized humanely. b Periodic acid–schiff (PAS) stained sections of spleens from infected animals were imaged. Tissues from intraperitoneally injected mice were fixed, sectioned, and stained for microscopy assays. c Morphological analysis of C. auris cells recovered from leg tissues described in panel (a). d Fungal burdens as determined through in vivo systemic infection mouse model. Typical yeast or filamentous cells were injected via the mouse tail vein. Fungal burdens of multiple organs were analyzed following 24 h of infection. e Morphological analysis of C. auris cells recovered from organ tissue samples described in panel (d). Recovered cells were plated and grown on YPD medium at 30 °C for 2 days and then transferred at 25 °C for 5 days of incubation. Scale bar represents 10 μm
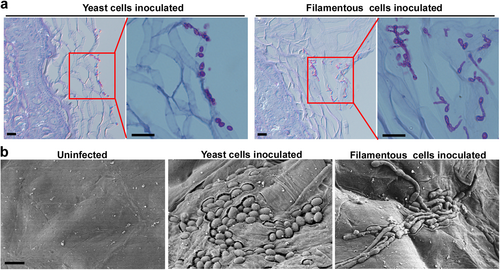
a 1 × 10⁷ typical yeast or filamentous cells were inoculated onto the skin of 2–5-day-old mice. After 24 h of infection, mice were humanely euthanized. Histopathological PAS sections of infected skin tissues were used for microscopy assays. Scale bar represents 10 μm. b Scanning electron microscope (SEM) images of infected skin tissues. 4 × 10⁶ typical yeast or filamentous cells were inoculated onto the skin of 2–5-day-old mice. After 24 h of infection, mice were euthanized humanely. Infected skin tissues were used for SEM assays. Scale bar represents 5 μm