
Figures & data
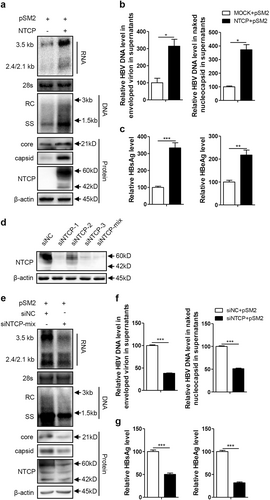
Huh7 and Huh7-NTCP cells transfected with the indicated plasmids or siRNAs were harvested at 72 h post transfection (hpt). a, e HBV transcription and replication intermediates were detected by northern blotting and Southern blotting, respectively (top panel). The positions of relaxed circular (RC) and single-stranded (SS) DNAs and HBV 3.5, 2.4, and 2.1-kb RNAs are indicated. The 28S ribosomal RNA served as a loading control. Expression of NTCP and core proteins and formation of capsids in the cells were analyzed by western blotting (bottom panel). Two bands of NTCP proteins, 60-kDa glycosylated and 42-kDa nonglycosylated, are indicated. β-actin served as a loading control. b, f Enveloped virions and naked nucleocapsids in culture supernatants were immunoprecipitated with anti-HBsAg and anti-core antibodies, respectively. HBV DNA was detected by real-time PCR (n = 3). c, g HBsAg and HBeAg in culture supernatants were detected by enzyme-linked immunosorbent assay (ELISA) (n ≥ 4). d The knockdown effects of the different siRNAs targeting NTCP were detected by western blotting. A two-tailed t-test was used to determine differences in multiple comparisons. *P < 0.05, **P < 0.01, ***P < 0.001
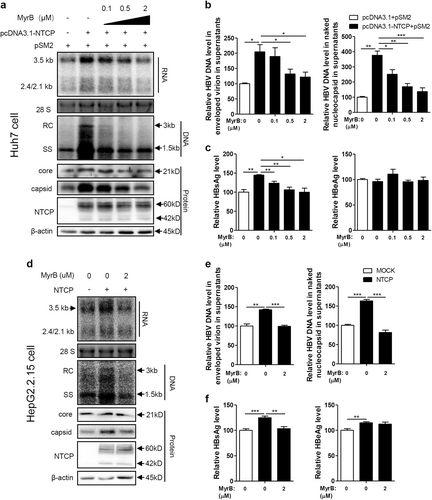
Huh7 cells transfected with the indicated plasmids, HepG2.2.15 cells and HepG2.2.15-NTCP cells were treated with MyrB at the indicated concentrations. a, d HBV transcription and replication intermediates were detected by northern blotting and Southern blotting, respectively (top panel). Expression of NTCP and core proteins and capsid formation in cells were analyzed by western blotting (bottom panel). b, e HBV DNA in enveloped virions and naked nucleocapsids in culture supernatants were detected by real-time PCR (n ≥ 3). c, f HBsAg and HBeAg in the culture supernatants were detected by ELISA (n ≥ 4). A two-tailed t-test was used to determine differences in the multiple comparisons. *P < 0.05, **P < 0.01, ***P < 0.001
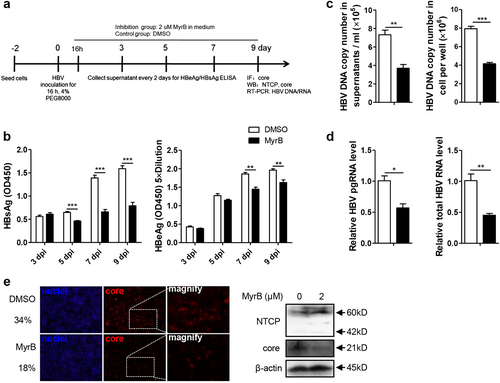
a Experimental layout: Huh7-NTCP cells were seeded in 12-well plates and inoculated with HBV in the presence of 4% PEG8000 for 16 h. Next, the cells were cultured with culture medium with 2 μM MyrB or equivoluminal DMSO added. b HBsAg and HBeAg were analyzed by ELISA (n = 4). c Supernatant HBV DNA, intracellular HBV DNA, d HBV pgRNA and total RNA were detected by real-time PCR (n ≥ 3). e Cells were fixed and immunostained with an antibody against the core protein (red) (magnification ×100); intracellular core protein was also detected by western blotting. A two-tailed t-test was used to determine differences in multiple comparisons. *P < 0.05, **P < 0.01, ***P < 0.001
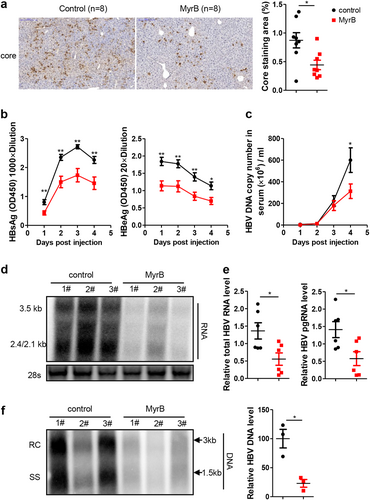
a Intrahepatic core proteins were detected by immunohistochemical staining at 4 days after hydrodynamic injection (dphi). The percentage of area showing stained core proteins was analyzed using a Panoramic MIDI Digital Slide Scanner (3DHISTECH). b HBsAg and HBeAg secreted in serum were detected by ELISA. c HBV DNA in serum was detected by real-time PCR. d, e HBV RNA in the liver was analyzed by northern blotting and real-time PCR, respectively. mRNA levels were normalized to mouse GAPDH (mGAPDH) mRNA. f HBV DNA in the liver was analyzed by Southern blotting, and the intensity of each lane was calculated using NIH ImageJ software. Data are representative of two independent experiments. A two-tailed t-test was used to determine the differences in multiple comparisons. *P < 0.05, **P < 0.01
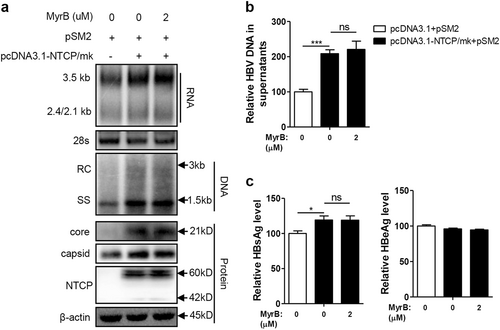
Huh7 cells transfected with the indicated plasmids were treated with 2 μM. a HBV transcription and replication intermediates were detected by northern blotting and Southern blotting, respectively (top panel). Expression of NTCP and core proteins and capsid formation in cells were analyzed by western blotting (bottom panel). b HBV DNA in culture supernatants were detected by real-time PCR (n = 4). c HBsAg and HBeAg in culture supernatants were detected by ELISA (n ≥ 4). A two-tailed t-test was used to determine differences in multiple comparisons. *P < 0.05, ***P < 0.001, ns: P > 0.05
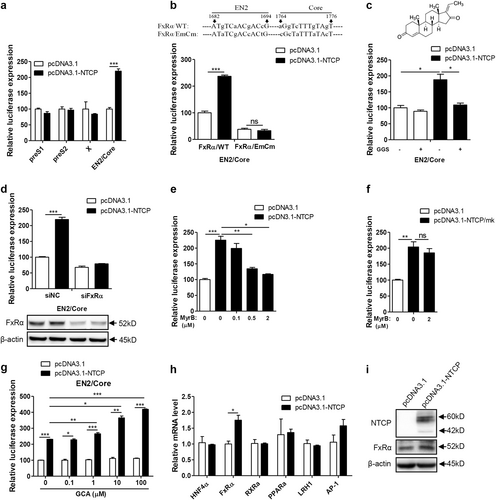
Huh7 cells transfected with the indicated plasmids were harvested. a Firefly luciferase activity was determined at 48 hpt. b Partial sequence of the construct pGL3-EN2/core (FxRα/WT) and the mutant construct of pGL3-EN2/core-FxRα/EmCm showed the FxRα binding sites and mutations introduced in EN2 (nts 1682 to 1694) and core (nts 1764 to 1776) promoter regions (top panel). Huh7 cells transfected with the indicated plasmids were harvested to determine firefly luciferase activity at 48 hpt (bottom panel). c Chemical structure of the FxRα antagonist GGS (top panel). Huh7 cells transfected with the indicated plasmids were treated with or without 10 µM GGS and then harvested to determine firefly luciferase activity at 48 hpt (bottom panel). d Huh7 cells transfected with the indicated plasmids and siRNAs were harvested to determine firefly luciferase activity at 48 hpt (top panel). The expression of FxRα was detected by western blotting (bottom panel). e–g Huh7 cells transfected with the indicated plasmids were treated with MyrB or GCA and then harvested to determine firefly luciferase activity at 48 hpt. h Total RNAs were extracted, and the mRNA levels of several transcription factors were detected by qRT-PCR. mRNA levels were normalized to β-actin mRNA. i The expression of FxRα was analyzed by western blotting. A two-tailed t-test was used to determine differences in multiple comparisons (n = 3). *P < 0.05, **P < 0.01, ***P < 0.001, ns: P > 0.05
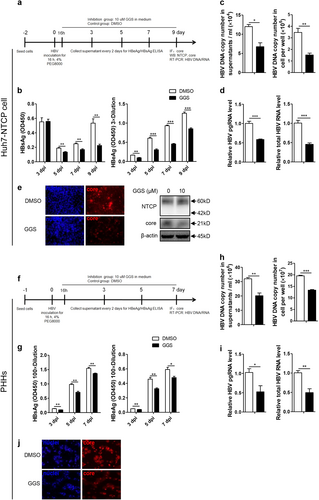
a, f Experimental layout: Huh7-NTCP cells and PHHs were severally seeded in 12-well plates and 48-wells plates and inoculated with HBV in the presence of 4% PEG8000 for 16 h. Next, the cells were cultured with culture medium added with 10 μM GGS or equivoluminal DMSO. b, g HBsAg and HBeAg were analyzed by ELISA (n ≥ 3). c, h Supernatant HBV DNA, intracellular HBV DNA, d, i HBV pgRNA and total RNA were detected by real-time PCR (n ≥ 3). e, j Cells were fixed and immunostained with an antibody against the core protein (red) (magnification ×200); e intracellular core protein was also detected by western blotting. A two-tailed t-test was used to determine differences in multiple comparisons. *P < 0.05, **P < 0.01, ***P < 0.001
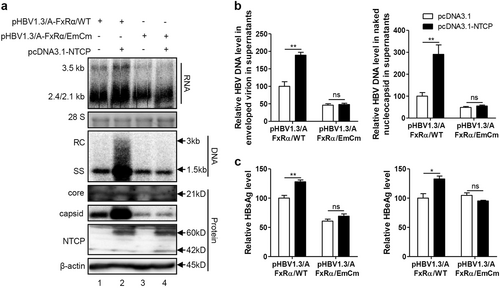
Huh7 cells transfected with the indicated plasmids were harvested at 72 hpt. a HBV transcription and replication intermediates were detected by northern blotting and Southern blotting, respectively (top panel). Expression of NTCP and core proteins and capsid formation in cells were analyzed by western blotting (bottom panel). b HBV DNA in enveloped virions and naked nucleocapsids in culture supernatants were detected by real-time PCR (n ≥ 3). c HBsAg and HBeAg in culture supernatants were detected by ELISA (n = 3). A two-tailed t-test was used to determine differences in multiple comparisons. *P < 0.05, **P < 0.01, ns: P > 0.05