
Figures & data
a The structures of AR-12, P12-23, and P12-34. b A549 cells treated with the indicated compounds for 24 h were processed for the LDH release assay. The total amount of LDH was measured after treatment with Triton X-100 (max). c–f A549 cells treated with AR-12, P12-23, and P12-34 were infected with DENV-2-eGFP (MOI 5), DENV-1~4 (MOI 5), JEV-eGFP (MOI 1), or ZIKV (MOI 0.5) for 24 h. The protein expression of eGFP (DENV-2-eGFP and JEV-eGFP) and viral NS3 (DENV-1~4 and ZIKV) was measured using a high-content image analysis system. Data are reported as the means ± SD (n = 3)
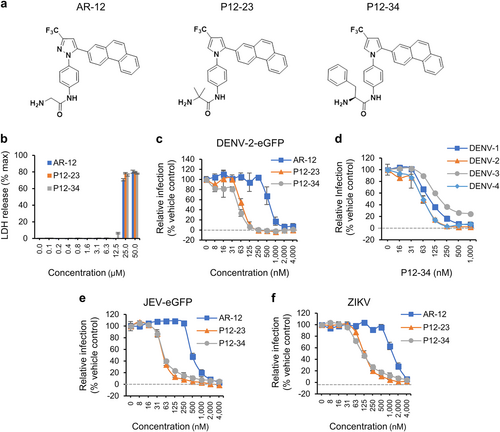
Inhibitory concentrations and cytotoxic concentrations of AR-12 and its derivatives in A549 cells
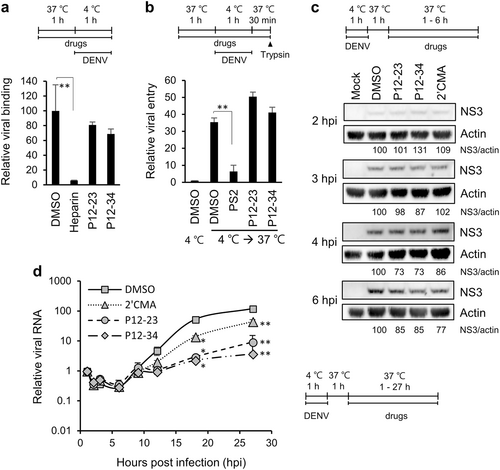
a For the viral binding assay, A549 cells and DENV-2 pretreated with P12-23, P12-34 or heparin were mixed and incubated at 4 ℃ for 1 h. Viral RNA was quantified via RT-qPCR to determine viral binding levels. b For the viral entry assay, A549 cells pretreated with P12-23, P12-34 or Pitstop®2 (PS2) were absorbed with DENV-2 at 4 ℃ for 1 h, then were shifted to 37 ℃ for 30 min. E protein-positive cells were quantified by flow cytometry after removing cell surface-associated viruses. c For the translation assay, DENV-2-infected A549 cells were treated with P12-23, P12-34 or 2′-C-methyladenosine (2′CMA) at 1 hpi. At the indicated times, cell lysates were harvested for western blot analysis. d For the viral RNA replication assay, DENV-2-infected A549 cells were treated with P12-23, P12-34 or 2′CMA at 1 hpi. Intracellular viral RNA levels were measured via RT-qPCR, and significance was determined by comparisons to the solvent control (DMSO). Data are reported as the means ± SD. *p < 0.05; **p < 0.01 by two-tailed Student’s t-test (n = 3)
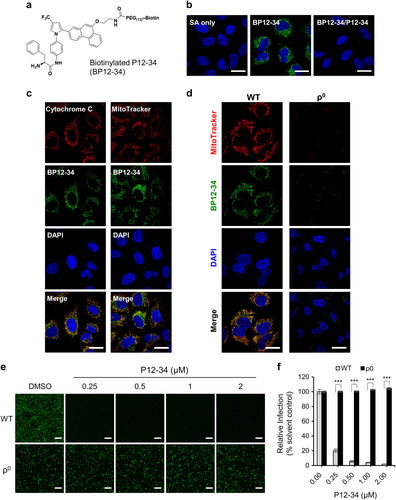
a Structure of biotinylated P12-34 (BP12-34). b A549 cells treated with BP12-34 were stained with fluorescent streptavidin (SA). In the BP12-34/P12-34 group, cells were pretreated with P12-34 prior to BP12-34 staining. c Mitochondria were stained with an anti-cytochrome c antibody and MitoTracker prior to BP12-34 staining. d Wild-type (WT) and mitochondria-depleted (ρ0) A549 cells were stained with MitoTracker and BP12-34. Nuclei were stained with DAPI. Scale bar = 20 µM. e, f WT and ρ0 A549 cells treated with P12-34 were infected with DENV-2-eGFP (MOI 5) for 24 h. Scale bar = 200 µM. eGFP-positive cells were measured using a high-content image analysis system and quantified using the DMSO solvent control to determine the relative viral infection. Data are reported as the means ± SEM. ***p < 0.0001 by two-tailed Student’s t-test (n = 3)
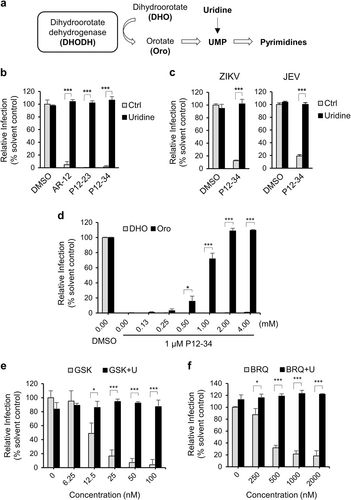
a Dihydroorotate dehydrogenase (DHODH) converts dihydroorotate (DHO) to orotate (Oro) for pyrimidine biosynthesis. b A549 cells infected with DENV-2-eGFP (MOI 5) were treated with P12-23 (1 µM), P12-34 (1 µM) or AR-12 (5 µM) in medium with or without uridine (50 µg/ml). c A549 cells infected with ZIKV (MOI 0.5) or JEV-eGFP (MOI 1) were treated with P12-34 (1 µM) with or without supplemented uridine (50 µg/ml). d A549 cells infected with DENV-2-eGFP (MOI 5) were treated with P12-34 (1 µM) in the presence of DHO or Oro. e A549 cells infected with DENV-2-eGFP (MOI 5) were treated with GSK983 (GSK) or brequinar (BRQ) in the presence or absence of 50 µg/ml uridine (U). eGFP or NS3 (ZIKV) expression was measured using a high-content image analysis system at 24 hpi. Data are reported as the means ± SD. *p < 0.05; ***p < 0.0001 by two-tailed Student’s t-test (n = 3)
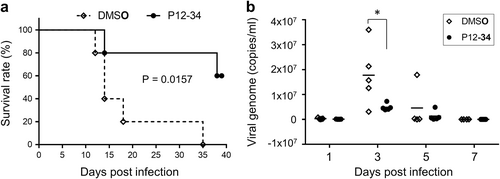
Stat1−/− mice subcutaneously challenged with a lethal dose of DENV-2 were intraperitoneally treated with P12-34 (2.5 mg/kg per day) or vehicle control (DMSO) for the first 6 days of infection. a Survival of mice with or without P12-34 treatment. The P value was determined using a Log-rank (Mantel-Cox) test (n = 5). b The viral loads in sera quantified by RT-qPCR are shown as the mean (bar) and as individual data. *p < 0.05, determined by two-tailed Student’s t-test (n = 5)