Figures & data
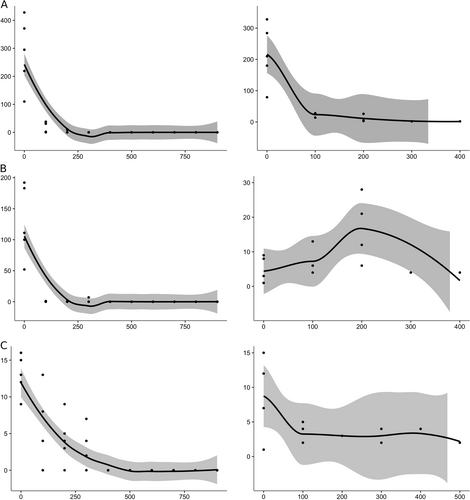
Fig. 1 Charts in ggplot with LOESS smoothing showing the total number of eggs (left panels) and Ae. albopictus females (right panels) on the y-axis as a function of the distance (in meters) from the forest edge (x-axis) at the (a) Adolpho Ducke, (b) Pedra Branca, and (c) Morro dos Macacos sampling sites. The shaded area represents the 95% confidence interval of the mean value (solid line). Statistical details are provided in Table S4
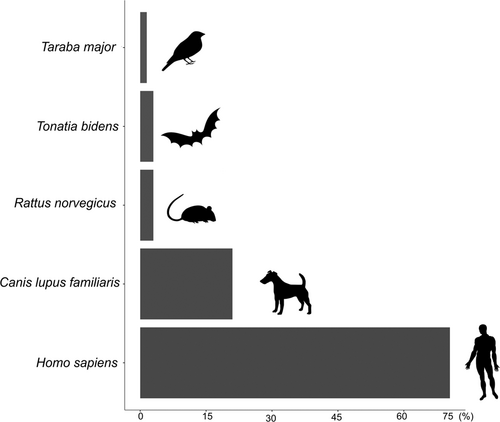
The bar graph value was calculated using data from 66 Ae. albopictus specimens analyzed without distinction of area or collection distance from the forest edge
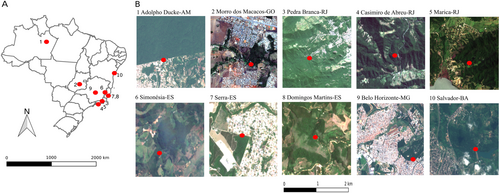
a Localization of the ten sites in Brazil; b Satellite images showing each sampling site as a red dot. Satellite images were downloaded from https://earthexplorer.usgs.gov and the maps were drawn using Qgis 2.18.14