Figures & data
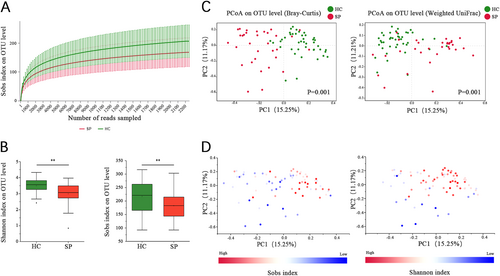
(A) Rarefaction curves were used to compare species richness between the SP and HC groups. (B) Wilcoxon’s test shows that the differences in the Sobs and Shannon indices between the SP and HC groups were significant at the OTU level (**P value < 0.01, Wilcoxon rank sum test). (C) A principal coordinate analysis (PCoA) for the HC and SP groups, with plots based on both the Bray−Curtis distance (Pr(>F) = 0.001) and Weight-UniFrac distance matrices (Pr(>F) = 0.009, PERMANOVA test). The first two coordinates are plotted with the percentage of variability as indicated on the axis. Each point represents a sample, and the colors represent different groups. (D) The Sobs and Shannon indices for each sample are represented by points on a Bray−Curtis distance PCoA, where a blue point represents a low value, a white point represents a mid-value and a red point represent a high value
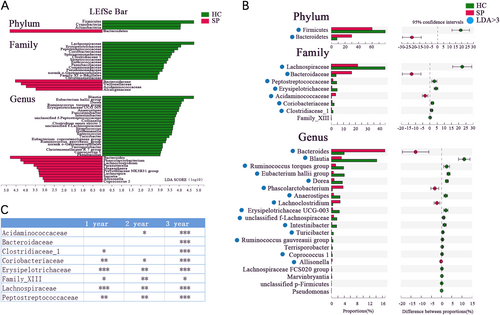
(A) Taxonomic cladogram obtained using linear discriminant analysis (LDA) effect size (LEfSe) analysis. LEfSe identified the taxa with the greatest differences in abundance between the SP and HC groups. At the phylum, family, and genus levels, only taxa meeting a significant LDA threshold value of >3 are shown. (B) Wilcoxon rank sum test was used for comparisons of the relative abundances at the phylum, family, and genus levels in the SP and HC groups. Only Pfdr values < 0.05 are shown, and the blue points indicate that the taxa appeared in (A). (C) Differentially abundant taxa at the family level between 1-, 2-, and 3-year subgroups and HC group respectively (Only Pfdr values < 0.05 are shown, *Pfdr < 0.05, **Pfdr < 0.01, ***Pfdr < 0.005)
Basic information and blood examination results
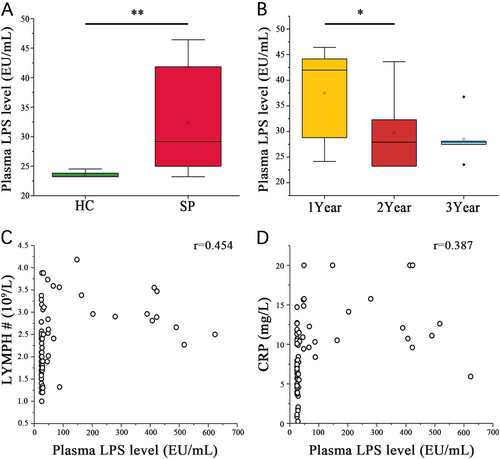
(A) Wilcoxon rank sum test shows that the SP and HC group plasma LPS levels are significantly different. (B) Wilcoxon rank sum test shows a significant difference in the plasma LPS levels among the patient subgroups stratified by postsplenectomy time (*P < 0.05, **P < 0.01, Wilcoxon rank sum test). Associations among plasma LPS level and (C) LYMPH# or (D) plasma CRP level in each sample were estimated using Spearman’s correlation analysis (r = 0.454, P < 0.05, Spearman’s rank test)
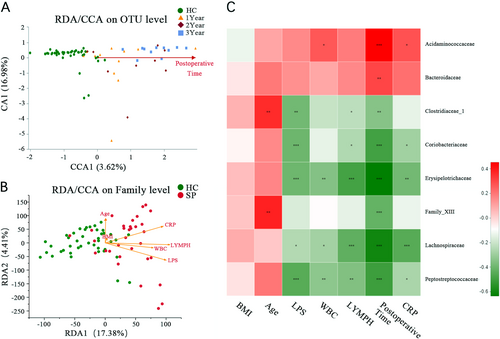
(A) CCA shows the composition of the gut microbiota is altered as the increasing postoperative time after splenectomy at the OTU level. (B) CCA shows the clinical parameters (including plasma LPS level, WBC, LYMPH#, BMI, CRP, and age) associated with the gut microbiota composition at the OTU level and associated with each other. (C) Association among seven clinical parameters and the relative abundances of eight families with altered abundances (see Fig. ) in the SP and HC groups were estimated using Spearman’s correlation analysis using Heatmap. Color intensity represents the magnitude of correlation. Red, positive correlations; green, negative correlations. *P value < 0.05; **P value < 0.01; ***P value < 0.001
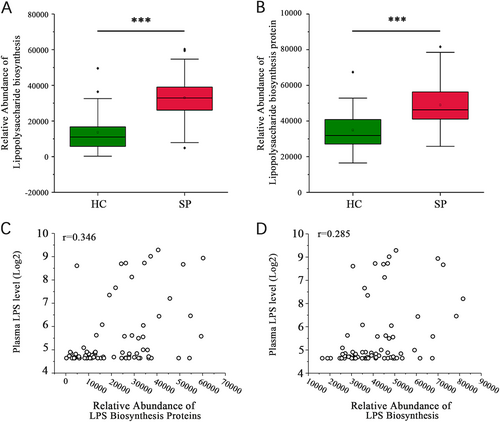
(A, B) Significant differences in the relative abundances of the lipopolysaccharide biosynthesis and lipopolysaccharide biosynthesis protein pathways between the SP and HC groups (***P < 0.001, Wilcoxon rank sum test). (C) The lipopolysaccharide biosynthesis proteins pathway is associated with the plasma LPS level (r = 0.346, P = 0.003, Spearman’s rank test). (D) The lipopolysaccharide biosynthesis pathway is associated with the plasma LPS level (r = 0.285, P = 0.014, Spearman’s rank test)