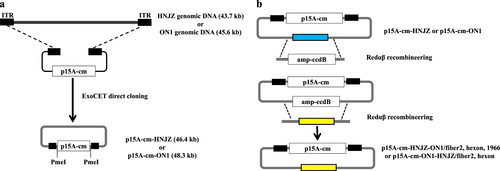
Figures & data
a Direct cloning of the whole genomes of a highly pathogenic FAdV-4 isolate CH/HNJZ/2015 and a nonpathogenic strain ON1 into p15A-cm vectors using the ExoCET (Exonuclease Combined with RecET) method. ITR, inverted terminal repeat. b Generation of fiber2, hexon, and 1966-bp fragment-replaced mutant/recombinant viruses. Redαβ recombineering and ccdB counter-selection were used to seamlessly replace the fiber-2 and hexon genes and the 1966-bp deletion region of HNJZ in p15A-cm-HNJZ with their ON1counterparts and the fiber2 and hexon genes of ON1 in p15A-cm-ON1 with their HNJZ counterparts
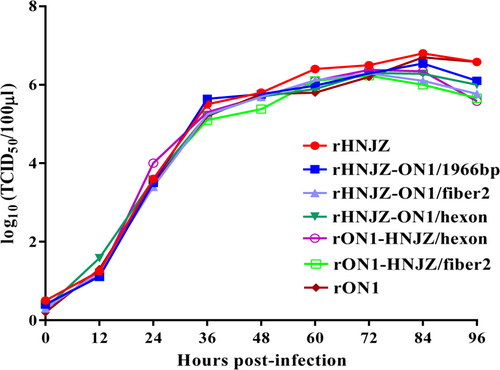
Leghorn male hepatocellular (LMH) cells were infected with rescued parent and mutant viruses at a multiplicity of infection of 0.001, and each virus was harvested at the indicated time points and titrated as described. Total viral titers were determined in three technical replicates and are expressed as the median tissue culture infective dose (TCID50/100 μl)
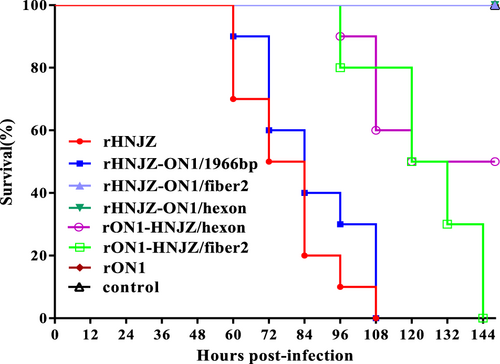
Seven groups, each consisting of 10 3-week-old SPF chickens, were infected orally with 0.2 ml of 105 TCID50 of each rescued FAdV-4 strain. One group of 10 chickens was left uninfected as control. The infected and control groups were separately housed in different negative-pressure isolators and monitored daily for 14 days, and the morbidity and mortality of animals were recorded
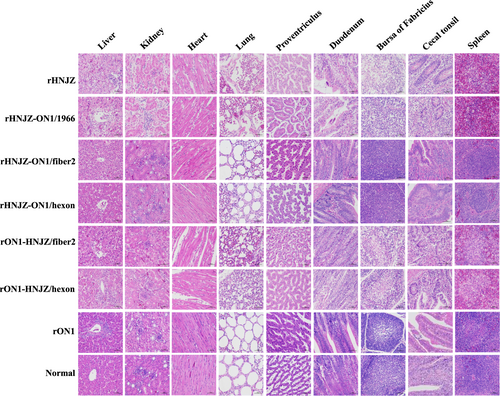
Degeneration, necrosis of hepatocytes, and intranuclear inclusion bodies in hepatocytes; lymphocytic infiltrates in association with myocarditis; degeneration and vacuolar necrosis of renal tubular epithelium; glandular epithelial cell edema and necrosis in proventriculus; pulmonary interstitial edema and lymphocyte infiltration in the lungs; mucosal epithelial cell nuclear fragmentation, disintegration and necrosis, and intestinal villi necrosis in the duodenums; disintegration of lymphocytes of bursa of Fabricius; severe reduction and necrosis of lymphocytes in the spleens; partial necrosis of the lymphocytes in the lamina propria; and necrosis of the crypt epithelial cells in the cecal tonsils were detected in chickens infected with rHNJZ, rHNJZ-ON1/1966, rON1-HNJZ/fiber2, and rON1-HNJZ/hexon. No lesions were observed in the corresponding tissues of chickens in the control group or in the rON1, rHNJZ-ON1/hexon, and rHNJZ-ON1/fiber2 inoculated groups. (H&E stain, original magnification 400×, scale bar = 50 μm)
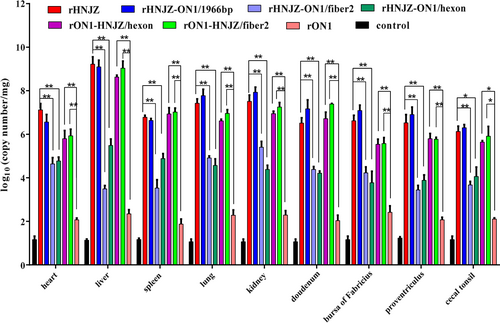
Heart, liver, kidney, spleen, lung, proventriculus, duodenum, bursa of Fabricius, and cecal tonsil tissue samples of chickens in each group were collected from dead chickens during the experiment or euthanized chickens at the end of experiment. Viral loads in different tissues were determined by a SYBR Green I quantitative real-time PCR using FAdV-4 ORF14 gene as an indicator for the presence of viral DNA. The final concentration was calculated as copy numbers per milligram of tissue sample. Results are presented at the means ± standard error of mean. Asterisks (*) mark the viral loads that were significantly different between the groups (p < 0.05)
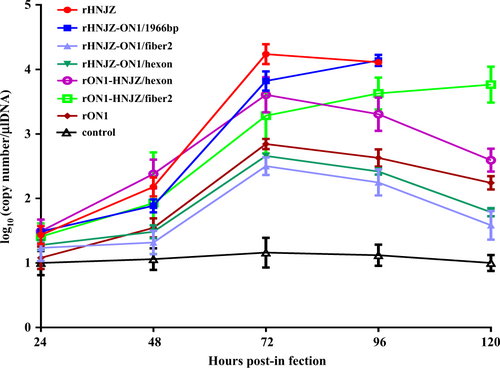
Cloacal swabs were collected at 24, 48, 72, 96, and 120 h postinfection (h.p.i.) and their virus loads were determined by a SYBR Green I quantitative real-time PCR assay using the FAdV-4 ORF14 gene as an indicator for the presence of viral DNA. The final concentration was calculated as copy numbers per microliter of extracted DNA from cloacal swabs. The results are presented at the means ± standard error of mean