Figures & data
Antimicrobial susceptibility profiles of the four isolated S. aureus strains. All MICs were obtained by use of E-tests, except for dalbavancin where a broth microdilution assay was performed additionally
Oligonucleotides used for PCR analysis
Genetic differences among the four consecutively obtained isolates
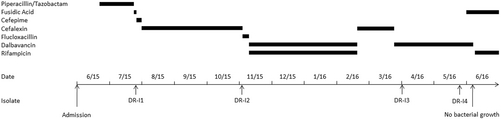
Fig. 1 Time history of antimicrobial usage and bacterial isolation
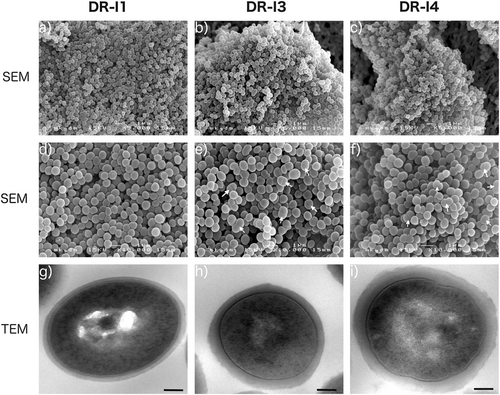
Scanning electron micrographs at a magnification of ×5000 (a, b, c) and ×10,000 (d, e, f), as well as transmission electron micrographs at a magnification of ×30,000 (g, h, i). White arrows indicate dividing bacterial cells
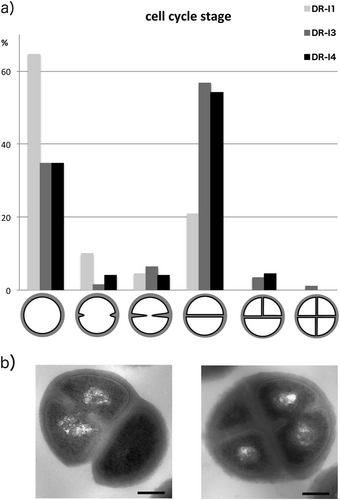
a Relative numbers of bacterial cells per morphologic cell cycle stage presented as % of 200 counted cells. b Exemplary pictures of irregular cell division observed in the two isolates DR-I3 and DR-I4