Figures & data
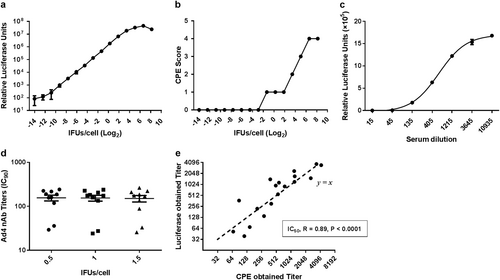
Serial dilutions of the Ad4-Luc recombinant virus were added to 2×10⁴ A549 cells in a 96-well plate (a and b). a The CPE score was divided into 5 levels (0–4) that represent approximately 0, 25, 50, 75, and 100% of cells exhibiting cytopathic effects after 1 day of viral infection, respectively. b Luciferase expression was also measured at 24 h postinfection. c Serial dilutions of HAdV-4-positive serum samples were incubated with Ad4-Luc and then were used to infect A549 cells. The luciferase assay was performed at 24 h postinfection. d Ten HAdV-4-positive serum samples were incubated with Ad4-Luc at three fixed IFU/cells ratios (0.5, 1, and 1.5). After the neutralization assay was performed, serum titers were calculated by the dilution level at which 90% of luciferase expression was inhibited. The difference between the three groups was analyzed by a one-way ANOVA test. e HAdV-4-positive serum samples were tested by two different neutralization assays, and the IC50 values obtained by the luciferase expression inhibition assay (y-axis) and the cytopathic effect assay (x-axis) were compared and analyzed for Spearman’s correlation coefficient
Demographics of all serum sample donors (n = 1013)
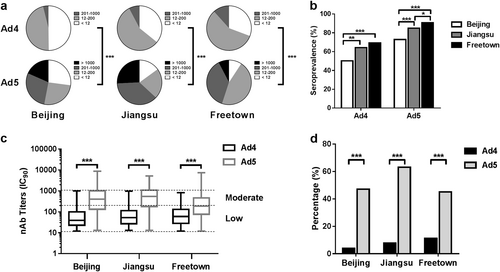
The nAb titers of HAdV-4 and HAdV-5 were tested using Ad4-Luc- and Ad5-Luc-based neutralization assays (IC90) and were categorized into four subgroups as follows: negative, <12; low, 12–200; moderate, 201–1000; and high, >1000. The nAb distributions (a) and the seropositive rates (b) of HAdV-4 and HAdV-5 in Beijing, Jiangsu, and Sierra Leone are shown. The data were analyzed by the Pearson chi-square test. c The difference in the nAb titers between HAdV-4- and HAdV-5-positive serum samples was analyzed by the Mann–Whitney test. d The percentages of serum samples with moderate or high levels of HAdV-4 and HAdV-5 nAbs are shown. The comparison was performed with the Pearson chi-square test. In all of the above comparison tests, a P value of <0.05 was considered to be significant; **P value < 0.01, ***P value < 0.001
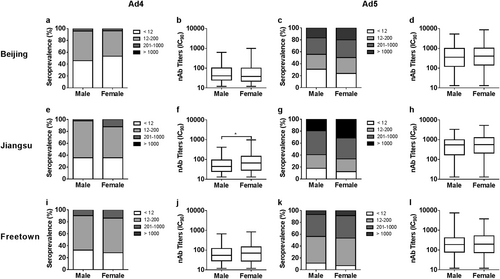
The distributions of HAdV-4 and HAdV-5 nAbs between males and females in Beijing (a, c), Jiangsu (e, g) and Freetown (i, k) are shown. The comparisons of adenovirus seropositive rates between gender groups were analyzed by Pearson chi-square tests. The HAdV-4 and HAdV-5 nAb titers between males and females with detectable nAbs from Beijing (b, d), Jiangsu (f, h), and Freetown (j, l) are shown. The data were analyzed by Mann–Whitney tests. In all the above comparison tests, a P value of <0.05 was considered significant
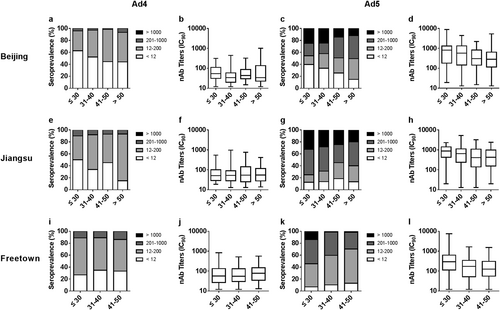
The distribution of HAdV-4 and HAdV-5 nAbs in age groups in Beijing (a, c), Jiangsu (e, g), and Freetown (i, k) are shown. The trends in adenovirus seropositive rate versus age were analyzed by Cochran–Armitage trend tests. The titers of HAdV-4 and HAdV-5 nAbs in seropositive donor age groups in Beijing (b, d), Jiangsu (f, h), and Freetown (j, l) are shown. The data were analyzed by Jonckheere–Terpstra tests
Cross-neutralization reaction analysis between HAdV-4 and HAdV-5 nAbs
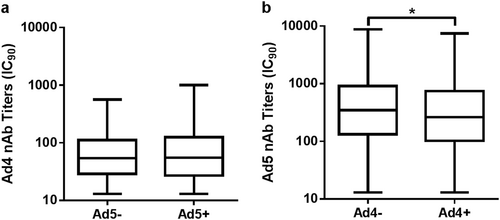
The nAb levels of HAdV-5 (a) or HAdV-4 (b) in single- and double-positive blood donors are shown. The comparison was analyzed by Mann–Whitney tests, and a P value of <0.05 was considered significant