
Figures & data
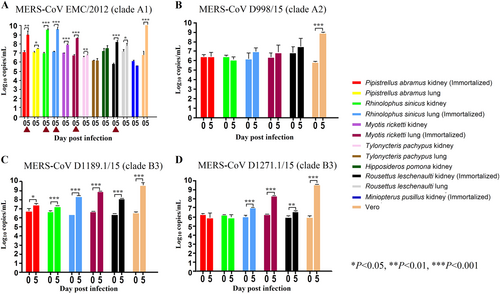
The 12 bat cell lines (PAK: Pipistrellus abramus kidney, PAL Pipistrellus abramus lung, RSK: Rhinolophus sinicus kidney, RSL: Rhinolophus sinicus lung, MRK: Myotis ricketti kidney, MRL: Myotis ricketti lung, TPK: Tylonycteris pachypus kidney, TPL: Tylonycteris pachypus lung, HPK: Hipposideros pomona kidney, RLK: Rousettus leschenaultii kidney, RLL: Rousettus leschenaultii lung, MPK: Miniopterus pusillus kidney) and Vero cells were subject to infection by MERS-CoV EMC/2012 (belonging to clade A1) with MOI of 1 (a). Culture supernatants were harvested at day 0 and 5 postinfection. Viral titers were determined by real-time quantitative RT-PCR. Viral load was expressed as log10 copies/mL. Error bars indicate the standard deviation of triplicate samples. The five bat cell lines susceptible to MERS-CoV EMC/2012 infection with ≥ 1 log10 increase in viral load at day 5 were marked with red triangles. They were subject to infection by three other MERS-CoV strains isolated from camels in Dubai, D998/15 (belonging to clade A2) (b), D1189.1/15 (c) and D1271.1/15 (d) (belonging to clade B3) (b). Different MERS-CoV strains displayed different infectivities in these five bat cells. (*P < 0.05; **P < 0.01; ***P < 0.001)
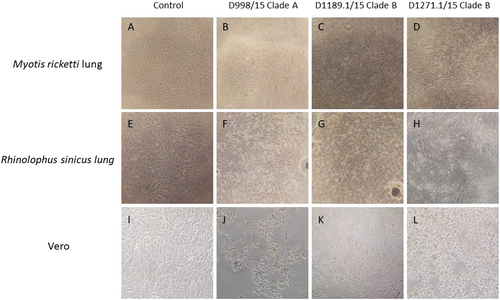
CPE was compared between Myotis ricketti lung (immortalized) cells that were uninfected (control) (a), and infected with Dubai camel MERS strains D998/15 (b), D1189.1/15 (c) & D1271.1/15 (d). CPE was compared between Rhinolophus sinicus lung (immortalized) cells that were uninfected (control) (e), and infected with Dubai camel MERS strains D998/15 (f), D1189.1/15 (g), and D1271.1/15 (h). CPE was compared between Vero cells that were uninfected (control) (i), and infected with Dubai camel MERS strains D998/15 (g), D1189.1/15 (k), and D1271.1/15 (l)
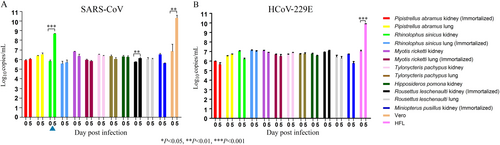
The 12 bat cell lines (PAK: Pipistrellus abramus kidney, PAL Pipistrellus abramus lung, RSK: Rhinolophus sinicus kidney, RSL: Rhinolophus sinicus lung, MRK: Myotis ricketti kidney, MRL: Myotis ricketti lung, TPK: Tylonycteris pachypus kidney, TPL: Tylonycteris pachypus lung, HPK: Hipposideros pomona kidney, RLK: Rousettus leschenaultii kidney, RLL: Rousettus leschenaultii lung, MPK: Miniopterus pusillus kidney) and Vero/HFL cells were subject to infection by SARS-CoV with MOI of 1 (a) and HCoV-229E with MOI of 0.01(b). Culture supernatants were harvested at day 0 and 5 postinfection. Viral titers were determined by real-time quantitative RT-PCR. Viral load was expressed as log10 copies/mL. Error bars indicate the standard deviation of triplicate samples. Only RSK cells can support SARS-CoV infection with ≥ 1 log10 increase in viral load at day 5 (blue triangle) and none of the 12 bat cell lines support HCoV-229E infection. (*P < 0.05; **P < 0.01; ***P < 0.001)
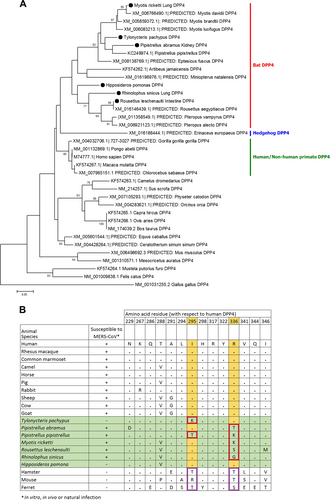
(a) The trees were constructed by Neighbor-Joining method using JTT substitution models and bootstrap values calculated from 1000 trees. Only bootstrap values >70% are shown. One hundred and twelve aa positions were included in the analyses. The scale bars represent 20 substitutions per site. Bat DPP4s that are sequenced in this study are labeled with black circles. Comparison of critical amino acid residues in DPP4 from different animal host for receptor binding in the region of residues 229–346 with respect to human DPP4 (b)
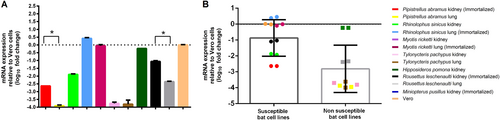
(a) mRNA levels of DPP4 were measured in various bat cells extracts by RT-qPCR and plotted relative to Vero cells, normalized by β-actin mRNA levels. The mRNA levels of DPP4 were compared between susceptible and non-susceptible bat cell lines (b). Statistical significance was assessed by Student’s t test P < 0.05
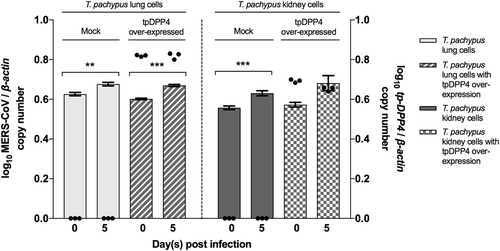
Cells were infected with MERS-CoV at a multiplicity of infection (MOI) of 1 for 5 days. Determination of MERS-CoV viral load in supernatant (n = 3) by RT-qPCR with normalization to β-actin (represented by bar). Determination of tpDPP4 expression in cell lysates (n = 3) by RT-qPCR with normalization to beta-actin (represented by dot). (*P < 0.05, **P < 0.01, ***P < 0.001)
Cell lines used in the present study
Primers used for RT-qPCR in this study