Figures & data
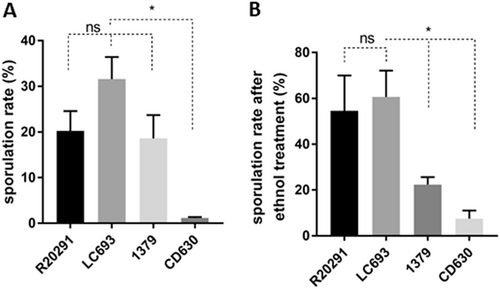
C. difficile strains were grown in 70:30 liquid sporulation medium and assayed for spore formation after 24 h of incubation. a Sporulation frequencies were plotted from direct enumeration of spores and vegetative cells in micrographs (data not shown). b Sporulation frequency determined by ethanol inactivation of vegetative cells. The means ± standard deviation of the mean from three biological replicates are shown. Student’s t-test was used to assess significance; ns not significant; *p < 0.05
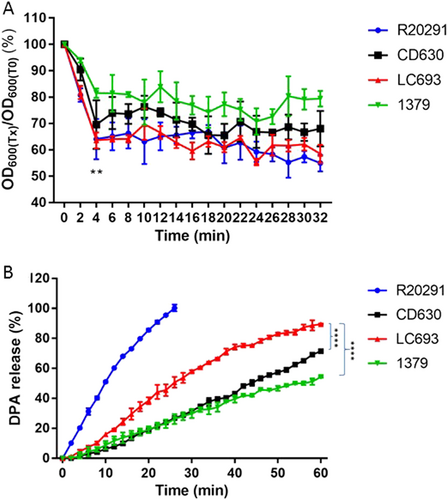
Purified C. difficile spores were suspended in buffer supplemented with taurocholic acid and glycine to induce germination. a Germination was monitored by plotting the ratio of the OD600 at a given time to the OD600 at time zero. **p = 0.0001, LC693 vs CD630 and strain 1379, one-way ANOVA. b CaDPA release from germinating C. difficile spores was monitored using Tb3+-fluorescence, and values were normalized to the maximum signal obtained for strain R20291 at 30 min. (****p < 0.0001). Data are reported as the means ± SD from three independent experiments
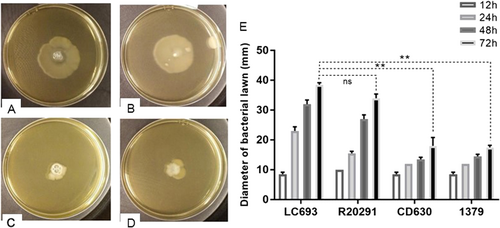
A single colony was inoculated in the middle of a swim plate, which was incubated at 37 °C for the indicated time. Swimming motility was quantitatively determined by measuring the radius of the zone of motility derived from a single colony. a–d Bacterial growth resulting from strains LC693 (a), R20291 (b), CD630 (c) and 1379 (d) after 72 h of incubation (e). Radius of the bacterial growth derived from a single colony of each strain. Data are reported as the means ± SD from three independent experiments, and differences were analyzed by Student’s t-test; ns not significant; **p < 0.001
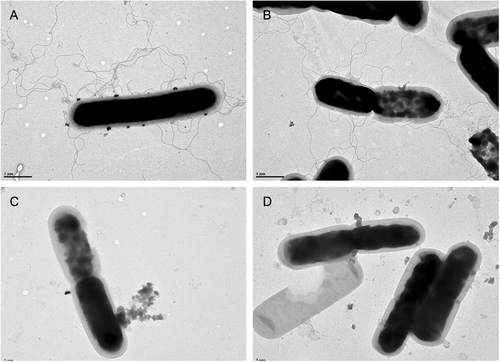
Flagella were visualized by transmission electron microscopy. Scale bar represents 1 μM. a LC693; b R20291; c CD630; and d 1379
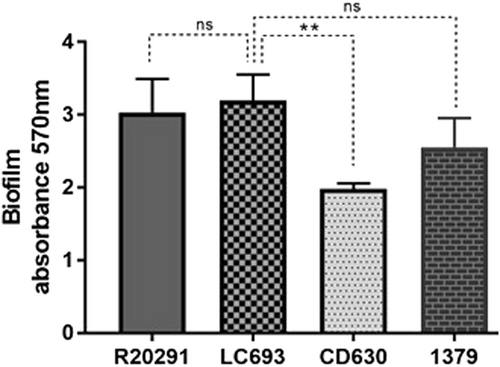
Biofilm formation was measured by crystal violet staining after 5 days of growth in reinforced clostridial medium. Data are from three biological replicates and are reported as the means ± SD. Student’s t-test was used for assess significance; ns not significant; **p < 0.001
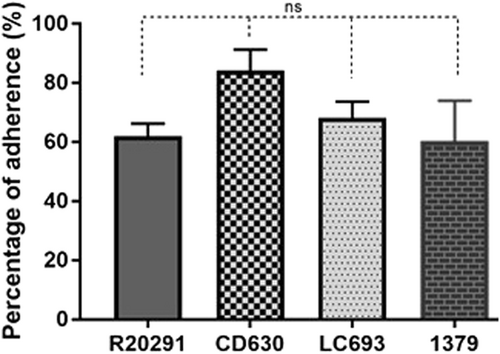
HCT-8 cells were incubated with spores for 100 min under anaerobic conditions, and the relative amount of adhered spores was subsequently calculated. ns: not significant
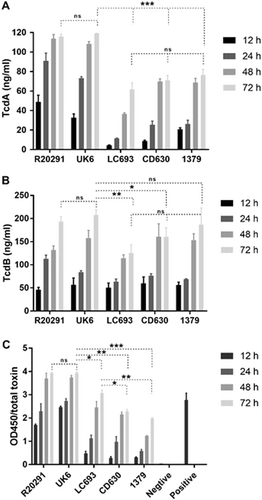
Toxin production at four different time-points was measured. a TcdA concentration in culture supernatant as determined by conventional ELISA; b TcdB concentration in culture supernatant as determined by conventional ELISA; c Total toxin released into the supernatant as measured using the C. DIFFICILE TOX A/B II™ assay. Student’s t-test was used for to assess significance; ns not significant; *p < 0.05; **p < 0.001; ***p = 0.0001
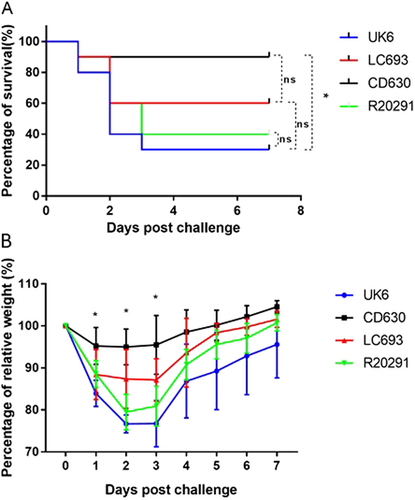
Four groups of mice (n = 10) were challenged with 106 spores of UK6, LC693, CD630, or R20291. Mice were monitored for one week for survival (a) and weight changes (b). Animal survival was analyzed by Kaplan–Meier survival analysis with a log-rank test of significance (ns not significant, p > 0.05). The mean relative weight of mice was analyzed for significance using a Student’s t-test. *p < 0.05 between the CD630 and LC693 groups at 1, 2 and 3 days post challenge; p < 0.05, between the CD693 and UK6 groups at 2, 3, 5, 6, and 7 days post challenge; p < 0.05 between the LC693 and R20291 groups at 2 and 3 days post challenge; and p > 0.05 between the UK6 and R20191 groups at all assayed time points