Figures & data
MDR-Mtb-V791, a clinical isolate from a MDR-TB patient (Clinical ID 20120824), exhibited resistance to clinical TB drugs
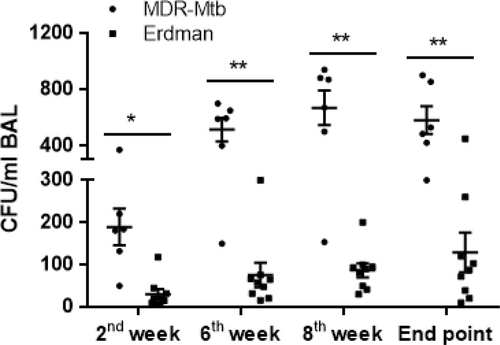
Data are represented as the median number ± SEM of M. tuberculosis bacilli in the BALF at different time points after pulmonary infection that was introduced by bronchoscope-guided inoculation of MDR-Mtb and Erdman-Mtb. ***p < 0.001, **p < 0.01, *p < 0.05, according to nonparametric comparisons between groups infected with MDR-Mtb (n = 6) and Erdman-Mtb (n = 9)
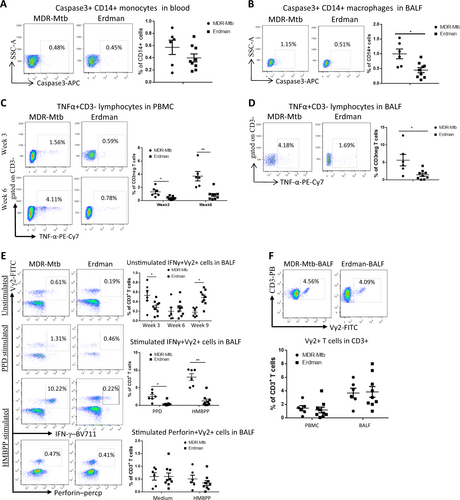
a Representative dot plots of caspase 3+ CD14+ monocyte profiles in the blood at week 3 from MDR-Mtb- and Erdman-Mtb-infected macaques. The population containing surrogate monocytes was gated in the standard size/light scatters. Baseline levels of caspase 3+ CD14+ monocytes/macrophages in the blood or BALF were <0.1% (data not shown). b Data are represented as the mean percentages of caspase 3+ CD14+ macrophages in the BALF from MDR-Mtb- and Erdman-Mtb-infected macaques in week 3. The population containing surrogate macrophages was gated in the standard forward/light scatters. c Representative flow plots show TNF-α+ CD3− effector lymphocytes in the blood from MDR-Mtb- and Erdman-Mtb-infected macaques in weeks 3 and 6. d Representative flow plots show TNF-α+ CD3− lymphocytes in week 6 in the BALF from MDR-Mtb- and Erdman-Mtb-infected macaques. e Representative flow plots show CD3+ Vγ2+ T effector cells in the BALF from MDR-Mtb- and Erdman-Mtb-infected macaques. The upper panels show Vγ2+ T cells constitutively producing IFN-γ in the absence of the antigen stimulation of cells in the BALF collected in weeks 3, 6, and 9. The baseline levels of constitutive IFN-γ+ Vγ2+ T cells before infection were <0.01–0.1%. The middle panels show the mean frequencies of CD3+ Vγ2+ IFN-γ+ T effector cells after PPD or HMBPP stimulation of BALF cells collected in week 3. The values measured in the medium alone were subtracted from the experimental measurements. The lower panel shows the mean percentage of CD3+ Vγ2+ perforin+ T cells after medium or HMBPP stimulation of BALF cells collected in week 3. Vγ2+ T effector cells were measured by ICS as previously described. Data were derived from up to six MDR-Mtb-infected macaques and nine Erdman-Mtb-infected macaques. **p < 0.01, *p < 0.05. f Representative flow histograms show the frequencies of CD3+ Vγ2+ T cells in PBMCs and the BALF in week 3. Data are represented as the mean + ± SEM of the percentages (%) and were analyzed by the Mann–Whitney test (nonparametric method)
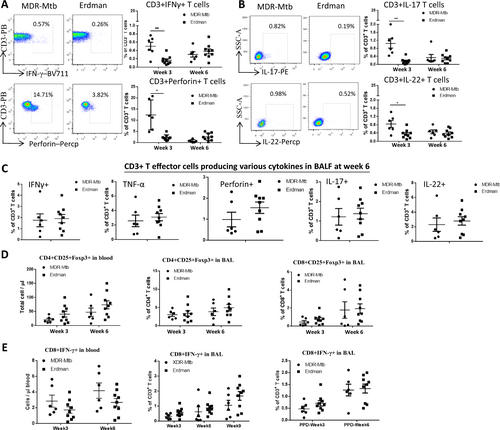
a Representative flow cytometry data (left) show percentages of CD3+ T effector cells producing IFN-γ (upper panel) and perforin in PBMCs from MDR-Mtb- and Erdman-infected macaques at weeks 3 and 6, respectively. Data are represented as the mean ± SEM. b Representative flow cytometry data (left) show percentages of CD3+ T effector cells producing IL-17 (upper panel) or IL-22 in PBMCs at weeks 3 and 6, respectively. Data are represented as the mean ± SEM. c The data represent the mean percentages ± SEM of CD3+ T effector cells producing IFN-γ and perforin, TNF-α, IL-17, and IL-22 in BALF at week 6. d The data show the mean numbers or percentages ± SEM of CD4+ CD25+ Foxp3+ T cells in blood and BAL and those of CD8+ CD25+ Foxp3+ T cells in BAL at weeks 3 and 6 after infection. e Data are represented as the mean numbers or percentages ± SEM of CD8+ IFN-γ+ T cells in blood and BALF measured by ICS with or without PPD stimulation at different time points. Similar data trends for CD4+ IFN-γ+ T cells in blood and BALF measured by ICS with or without PPD stimulation (data not shown). Data were derived from up to six MDR-Mtb-infected and nine Erdman-infected macaques and were analyzed by the Mann–Whitney test (nonparametric method). *p < 0.05, **p < 0.01
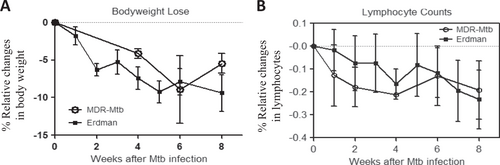
a Percent changes in body weights after infection compared to the baseline values. b Percent changes in blood lymphocyte counts after infection compared to the baseline values. Note that there were no significant differences in body weight or lymphocyte count between MDR-Mtb-infected and Erdman-Mtb-infected macaques. The data are represented as the mean ± SEM and were analyzed by the Mann–Whitney test (nonparametric method)
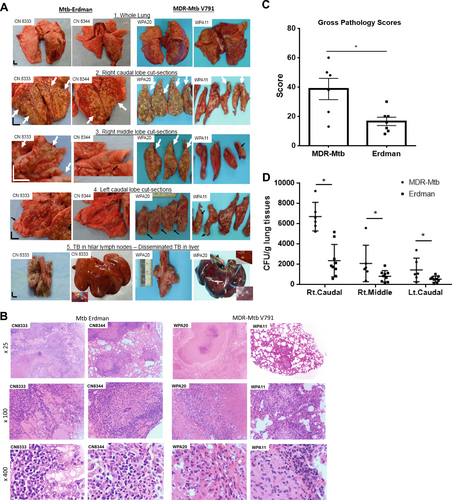
a Representative digital images of the whole lung (panel 1), sections of the right caudal (panel 2), right middle (panel 3), and left caudal (panel 4) lung lobes and the hilar lymph nodes/liver (panel 5) from MDR-Mtb-infected and Erdman-Mtb-infected macaques are shown. Representative MDR-Mtb-infected and Erdman-Mtb-infected macaques with both severe and less severe TB lesions are displayed, with the ID number of the representative monkeys indicated in the upper-left corner. WPA11 served as a less severe example despite moribund related to an overreaction to a transient IL2 treatment. Note that the lung lobes of Erdman-Mtb-infected macaques were opened, whereas those of MDR-Mtb-infected animals were sliced to adhere to the more stringent safety protocols. TB lesions could be adjudged based on the examples indicated by the white arrows demonstrating the presence of caseation pneumonia or extensive coalescing granulomas and by the examples indicated by the small arrows demonstrating less coalescing or noncoalescing granulomas. The vertical/horizontal bars at the bottom left represent the 1-cm scale derived from the fluorescence rulers of each original photo, including the sliced sections. In panel 5, which shows the liver, enlarged views of granulomas from selected areas (blue arrows) are shown in the upper or lower corners. Lungs and other organs were obtained during the necropsies that occurred 2.5–4 months after infection with Mtb. b Representative histopathological images of both the severe and less severe TB lesions in representative MDR-Mtb-infected and Erdman-Mtb-infected macaques. H&E stained sections of typical tubercles in the right caudal lobes taken from two representative macaques from each group, with the macaque ID number and magnification indicated in each image. The severe TB lesions from the MDR-Mtb-infected macaque (WPA20) and the Erdman-Mtb-infected macaque (CN8333) are characterized by widespread necrosis and tissue destruction. Many polymorphic leukocytes, epithelioid cells, macrophages, and degenerative or necrotic cells are seen in the edges of the tubercles. There was insufficient infiltration of lymphocytes. The less severe TB lesions shared by the MDR-Mtb-infected macaque (WPA11) and Erdman-Mtb-infected macaque (CN8344) were generally characterized by less necrotic tubercles, which were mainly composed of epithelioid cells, giant cells, fibroblasts, and macrophages. There were notable infiltration zones of lymphocytes, plasma cells, and macrophages around the tubercles. Note the modest amount of inflammatory effusion seen in the alveoli near the tubercles. c Mean gross pathology scores ± SEM for MDR-Mtb-infected macaques (n = 6) and Erdman-Mtb-infected animals (n = 9). The scores were calculated as previously described. Differences between groups were analyzed, but we cannot claim any biological significance due to the existence of different endpoints. In this study, we intended to assess the similarity of MDR TB to DS TB rather than to compare the extent/severity. Most MDR-Mtb-infected macaques received adalimumab near the endpoint. Erdman-Mtb-infected macaques were euthanized ~1–2 months earlier than MDR-Mtb-infected macaques due to budget constraints. d High levels of MDR-Mtb burdens in the lungs are associated with the pathology of MDR-TB. The CFU counts per gram equivalent to a milliliter of lung tissue homogenates of the right (Rt) caudal, right middle, and lower left lung lobes collected at the endpoints are shown. To estimate the lung infection levels, the CFUs of MDR-Mtb in lung lobes at the endpoint (at ~4.5 months) were aligned with those of Erdman-Mtb in lung lobes at 2–3 months. We conducted a statistical analysis to estimate the differences, but we cannot claim any biological significance due to the existence of different endpoints and other factors such as adalimumab (Supplementary Figure)