
Figures & data
Table 1 Batting scorecard for first test, India against Australia in India in October 2010
Table 2 Session-by-session scorecard for match in
Table 3 Best fitting multinomial logistic regression model at each stage, and showing Nagelkerke R2 and number of matches used to estimate the model
Table 4 The fitted parameter estimates for each session of the match with covariates lead (L), total wickets down by reference team (W1), total wickets down opposing team (W2) and ground effect (G)
Figure 1 For individual players: (a) total batting points (not lose criterion) versus runs in the match; (b) total wicket-taking points (not lose criterion) versus wickets share; (c) total batting points (win criterion) versus runs in the match; (d) total wicket-taking points (win criterion) versus wickets share; 1 (win), 0 (draw), −1 (loss) from point of view batting and bowling team; respectively (104 matches).
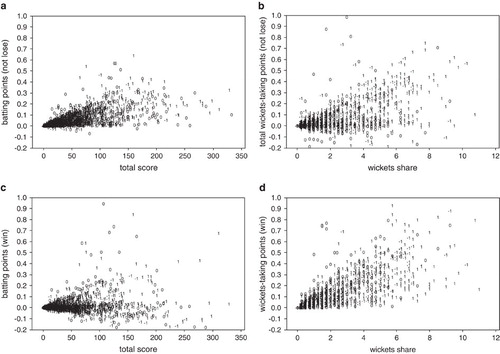
Table 5 Player contributions in the third Ashes test, Australia versus England, Perth, 2010
Table 6 Ashes series 2010/2011: Players in rank order of total contribution, batting and wicket taking (bowling and fielding)
Table 7 Raw player contributions for 2010 test series between India and South Africa in India, first test match
Table 8 Raw player contributions for 2010 test series between India and South Africa in India, second test match
Table 9 Total adjusted player contributions for the 2010 test series between India and South Africa in India (top 10 players)
Table 10 Batting, wicket taking and net player contributions (points) for 104 matches in 2010, 2011 and 2012
Table 11 2 × 2 cross-classification table for 104 test matches in 2010–2012 played by the top eight teams (30 drawn matches are ignored), classified by actual man of the match (MOM) on winning or losing side and highest rated player on winning or losing side