502
Views
5
CrossRef citations to date
0
Altmetric
Reasearch Articles

Seismic imaging for an ocean drilling site survey and its verification in the Izu rear arc

, , , &
Pages 1-10 | Received 15 Nov 2016, Accepted 17 Nov 2016, Published online: 06 Dec 2018

Figures & data

Fig. 1. Bathymetry of the northern Izu-Ogasawara arc showing the rear-arc drilling site U1437 (light blue star). Bold blue dotted lines show four en-echelon chains of back-arc seamounts extending obliquely in an ENE–WSW direction, from the back-arc knolls zone to the Shikoku Basin. Red and yellow lines indicate the survey lines used in this study.
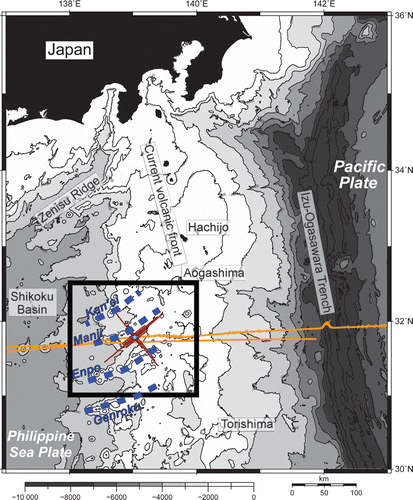
Fig. 1.  Bathymetry of the northern Izu-Ogasawara arc showing the rear-arc drilling site U1437 (light blue star). Bold blue dotted lines show four en-echelon chains of back-arc seamounts extending obliquely in an ENE–WSW direction, from the back-arc knolls zone to the Shikoku Basin. Red and yellow lines indicate the survey lines used in this study.

Table 1.  Seismic survey equipment and data acquisition parameters.

Fig. 2. Maps showing the site survey lines and detailed bathymetry around the Izu rear-arc drilling site U1437 (light blue star). (a) Pre-site survey lines. The numbers with white boxes in show the 40Ar–39Ar ages (Ma) of dredged samples obtained by CitationIshizuka et al. (2003). (b) High-resolution survey lines.
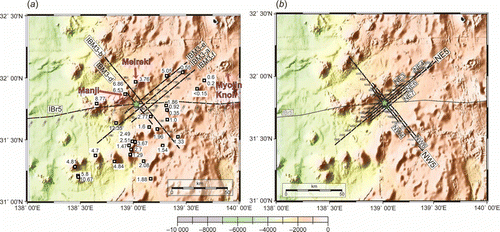
Fig. 2.  Maps showing the site survey lines and detailed bathymetry around the Izu rear-arc drilling site U1437 (light blue star). (a) Pre-site survey lines. The numbers with white boxes in Figure 2a show the 40Ar–39Ar ages (Ma) of dredged samples obtained by CitationIshizuka et al. (2003). (b) High-resolution survey lines.

Fig. 3. Seismic reflection profiles and interpretations obtained in the pre-site survey: (a) line IBM3e; (b) expanded interpretation of line IBM3e; (c) line IBM3d; (d) expanded interpretation of line IBM3d. Dotted boxes show the expanded areas around the drilling site U1437, indicated by arrows. Ages were obtained from dredged sample by CitationIshizuka et al. (2003).
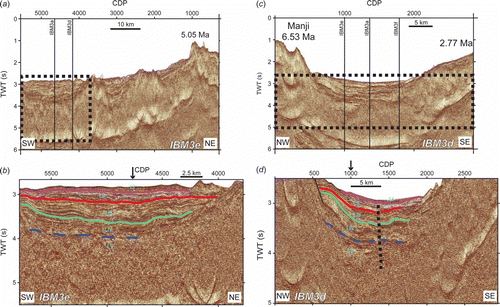
Fig. 3.  Seismic reflection profiles and interpretations obtained in the pre-site survey: (a) line IBM3e; (b) expanded interpretation of line IBM3e; (c) line IBM3d; (d) expanded interpretation of line IBM3d. Dotted boxes show the expanded areas around the drilling site U1437, indicated by arrows. Ages were obtained from dredged sample by CitationIshizuka et al. (2003).

Fig. 4. High-resolution seismic reflection profiles with interpretations: (a) line NE5 and (b) line NW5. Arrows with white rectangular boxes show the drillhole U1437.
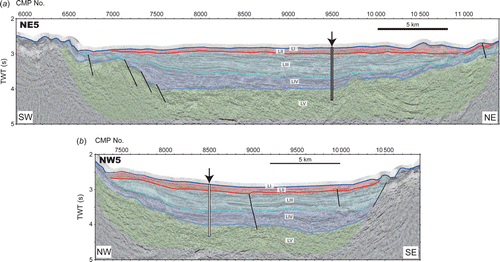
Fig. 4.  High-resolution seismic reflection profiles with interpretations: (a) line NE5 and (b) line NW5. Arrows with white rectangular boxes show the drillhole U1437.

Fig. 5. Seismic profiles of line IBr5 which runs east from the Manji seamount chains to the Empo seamount chains: (a) Detailed bathymetry map of the Shikoku Basin and en-echelon arrangements around the drilling site U1437, indicated by light blue star. (b) Final velocity model modified from CitationTakahashi et al. (2015). (c) Depth-converted seismic reflection profile, and expanded time-migrated profiles with our interpretation. The drilling site U1437 is also shown. (d) Interpretations of IBr5 from seismic reflection profiles and velocity model. The green rectangular box shows the location of drillhole U1437. Blue and red dashed lines indicate the velocity contours of 5 km/s and 6 km/s traced from (b), which are interpreted as the depth to igneous basement (upper crust) and middle crust, respectively.
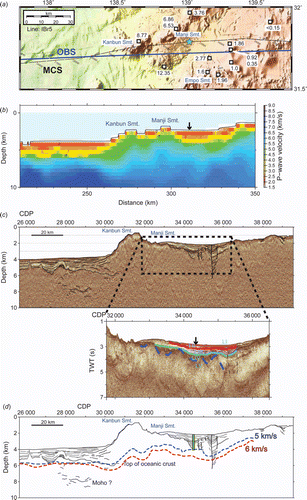
Fig. 5.  Seismic profiles of line IBr5 which runs east from the Manji seamount chains to the Empo seamount chains: (a) Detailed bathymetry map of the Shikoku Basin and en-echelon arrangements around the drilling site U1437, indicated by light blue star. (b) Final velocity model modified from CitationTakahashi et al. (2015). (c) Depth-converted seismic reflection profile, and expanded time-migrated profiles with our interpretation. The drilling site U1437 is also shown. (d) Interpretations of IBr5 from seismic reflection profiles and velocity model. The green rectangular box shows the location of drillhole U1437. Blue and red dashed lines indicate the velocity contours of 5 km/s and 6 km/s traced from (b), which are interpreted as the depth to igneous basement (upper crust) and middle crust, respectively.

Fig. 6. Lithologic columns at the drilling site U1437: (a) Seismic units interpreted before drilling; (b) geological column obtained from drilling and coring (CitationExpedition 350 Scientists, 2014); (c) depth converted seismic reflection profile with the interpretation of line NW5 around the drilling site U1437, calculated from the time-depth relationship derived from vertical seismic profiling in the drillhole (modified from CitationTamura et al., 2015); (d) detailed depth converted seismic reflection profile of line IBr5 around the drilling site U1437.
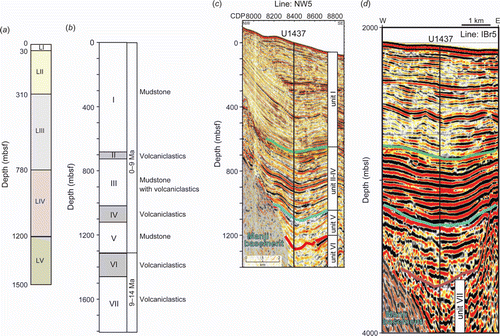
Fig. 6.  Lithologic columns at the drilling site U1437: (a) Seismic units interpreted before drilling; (b) geological column obtained from drilling and coring (CitationExpedition 350 Scientists, 2014); (c) depth converted seismic reflection profile with the interpretation of line NW5 around the drilling site U1437, calculated from the time-depth relationship derived from vertical seismic profiling in the drillhole (modified from CitationTamura et al., 2015); (d) detailed depth converted seismic reflection profile of line IBr5 around the drilling site U1437.

Fig. 7. Thickness variations in two-way traveltime estimated from the grid of site surveys around Site U1437: (a) thickness of unit I; (b) thickness from unit II – IV; (c) thickness of unit V; (d) thickness of unit VI. The yellow star shows the location of Site U1437.
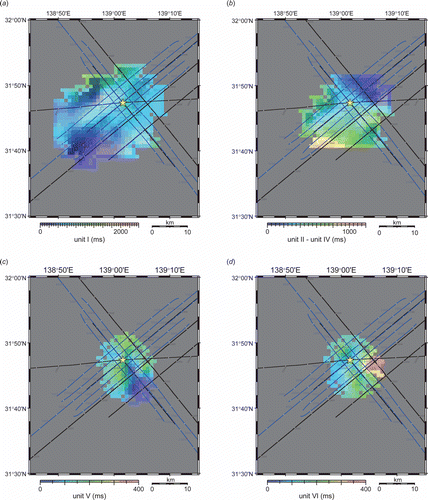
Fig. 7.  Thickness variations in two-way traveltime estimated from the grid of site surveys around Site U1437: (a) thickness of unit I; (b) thickness from unit II – IV; (c) thickness of unit V; (d) thickness of unit VI. The yellow star shows the location of Site U1437.

Fig. 8. Expanded profiles around the Site U1437 showing the nearest CDP traces to the site. These traces were used to calculate the coherence between the lines, shown in the coherence spectra: (a) 2.8–3.8 s window (unit I–III); (b) 3.8–4.8 s window (unit III–VII).
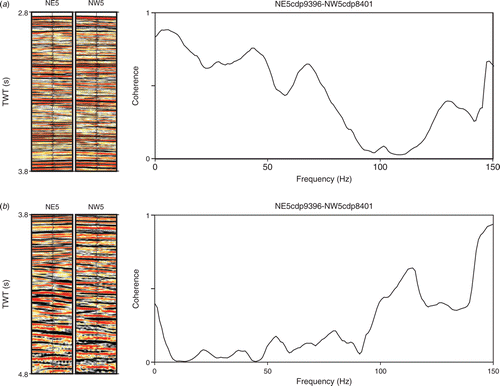
Fig. 8.  Expanded profiles around the Site U1437 showing the nearest CDP traces to the site. These traces were used to calculate the coherence between the lines, shown in the coherence spectra: (a) 2.8–3.8 s window (unit I–III); (b) 3.8–4.8 s window (unit III–VII).