Figures & data
Figure 1. Analysts’ ambiguity on the rise. Five-year median analysts’ dispersion (standard deviation) around the consensus estimate, 1976–2013 (2008 and 2009 omitted). Source: Lev and Gu (Citation2016).
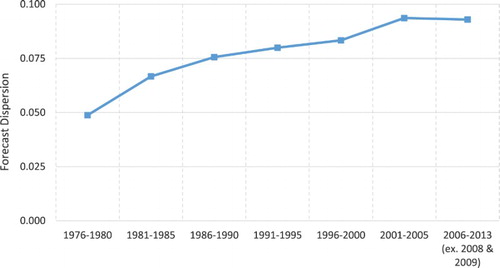
Figure 2. The intangibles revolution. US private sector investment in tangible and intangible capital (relative to gross value added), 1977–2014. Source: Courtesy of Corrado and Hulten.
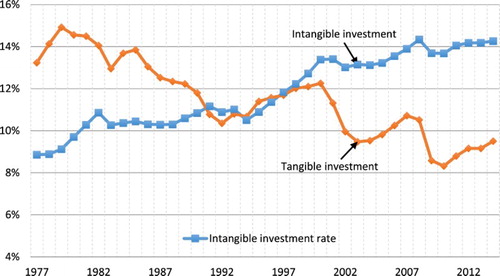
Figure 3. One-time items are not the cause of the deteriorating relation between earnings and market values.
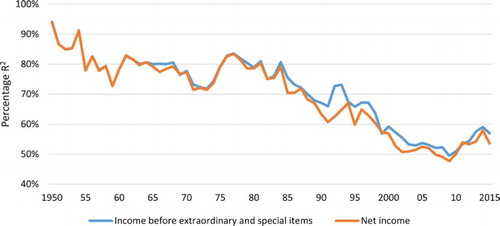
Figure 4. Declining matching between revenue and expenses over time: Low-intangibles vs. high-intangibles firms.
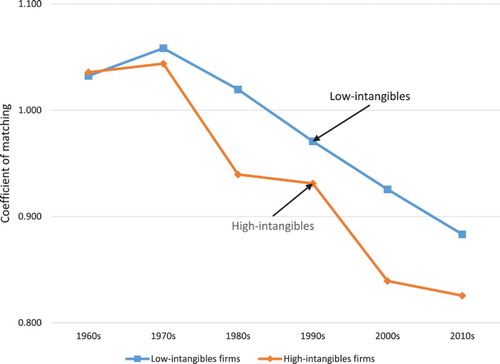
Figure 5. R2s of regressions of market values on earnings and book values of companies entering the public market in successive decades, 1950–2013. Source: Lev and Gu (Citation2016).
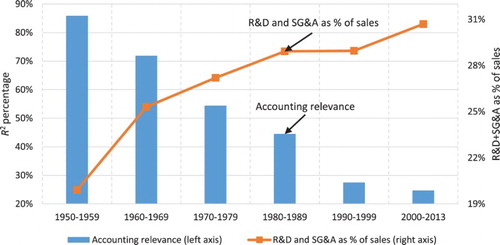
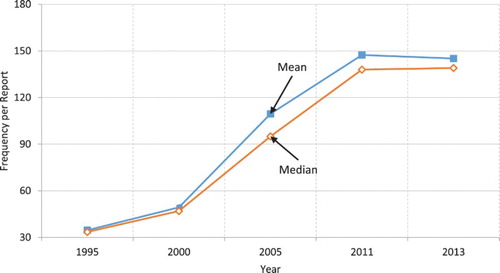
Figure 6. Increasing frequency of estimates-related terms in financial reports. For a sample of 50 S&P 500 companies. Source: Lev and Gu (Citation2016).