Figures & data
Figure 1. Predictions-H1 and H2. This figure presents predictions for the measures used in my experiment to capture participants’ investment likelihood judgments.
![Figure 1. Predictions-H1 and H2. This figure presents predictions for the measures used in my experiment to capture participants’ investment likelihood judgments.](/cms/asset/1218f70a-7dcd-429d-a900-e649f601472d/rabr_a_1922990_f0001_oc.jpg)
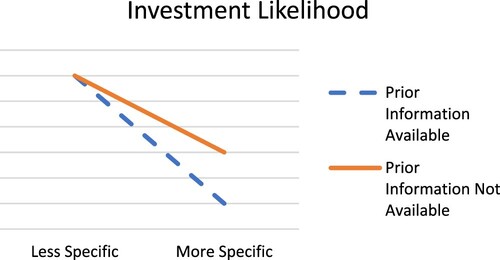
Table 1. Tests for hypotheses H1 and H2.
Figure 2. Results for H1 and H2. This figure presents the estimated marginal means of the measures used in my experiment to capture participants’ investment likelihood judgments.
![Figure 2. Results for H1 and H2. This figure presents the estimated marginal means of the measures used in my experiment to capture participants’ investment likelihood judgments.](/cms/asset/8816aa65-9441-4a23-b492-6221c17a5fe0/rabr_a_1922990_f0002_oc.jpg)
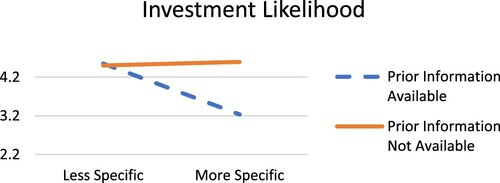
Table 2. Test for hypothesis H3.