
Figures & data
Figure 1: Development of M_REPORT and PAGE (Unscaled and Scaled)
Notes: Development of the yearly average disclosure visibility measures M_REPORT and PAGE over the sample period 2005–2018. PAGE (unscaled) is the variable PAGE before dividing by the total number of annual report pages. Both PAGE variables are presented before multiplying by −1.
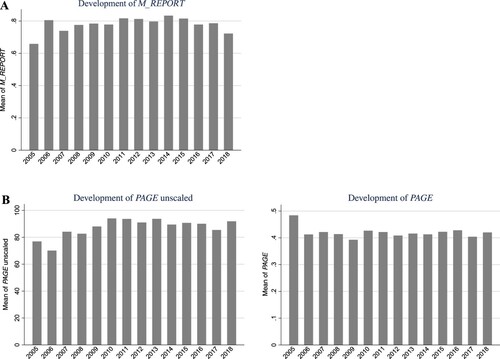
Table 1: ETR Conditions and Stakeholder Specific Assessments
Table 2: Variable Definitions
Table 3: Sample Selection (Sample Period 2005–2018)
Table 4: Summary Statistics
Table 5: ETR Conditions and Disclosure Visibility
Table 6: Family Firms
Table 7: ETR Decrease Level and Degree
Supplemental material