
Figures & data
Figure 1. Decision tree for categorising FTSE350 firm-year observations. Year t is the award year (2007–2019). This figure provides a framework for classifying firms into three categories based on (a) whether the firm was shortlisted for an award in year t and (b) whether it was shortlisted for an award in either the two previous years (t−2 or t−1) or the two subsequent years (t + 1 or t + 2). Category one (C1) consists of firms that was shortlisted in year t. Category two (C2) consists of firms that were not shortlisted in year t but shortlisted in the 5-year window t−2 to t + 2. Category three (C3) consists of firms that have not been shortlisted for an award in the period t−2 to t + 2.
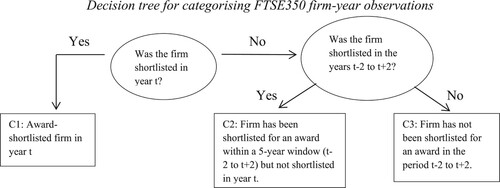
Table 1. Sample size and classification.
Table 2. Firm awards over the sample period.
Table 3. Duration of firms in the sample period (2007–2019).
Table 4. Distribution of industry division by award-year.
Table 5. Distribution and overlap of award observations by year.
Table 6. Tests of difference before matching
Table 7. Regression analysis: firm-level determinants of high-quality.
Table 8. Tests of difference after matching.
Table 9. Capital market effects of award shortlisting.
Table 10. Regression analysis: timeliness of information capture.