

Figures & data
Table 1. Baseline characteristics of the study patients.
Figure 1. Correlation plot between baseline values of the E/e′ ratio and the value of the pulmonary artery pressure as derived from the maximal transtricuspid gradient. A correlation line was fitted to the data (central thick line), as well as 95% confidence intervals (thin lateral lines).
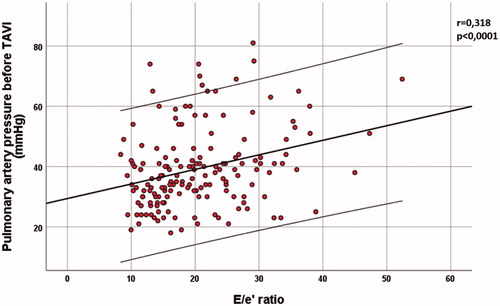
Table 2. Baseline determinants of PHT.
Table 3. Comparison between no improvement or worsening PAP vs. improved PAP.
Figure 2. Comparison between the groups of patients who improved their transtricuspid gradient 6 months after TAVI implantation (left boxplots) and the ones who did not improve or increased their gradient (right boxplots). The only significantly different parameters measured at baseline (before TAVI) according to our analysis were the E/e′ ratio (A) and maximal velocity of the tricuspid regurgitation (B). The higher E/e′ ratio and higher transtricuspid gradient probably reflect a more advanced state of disease in the patients who did not show improvement in pulmonary artery pressure after TAVI.
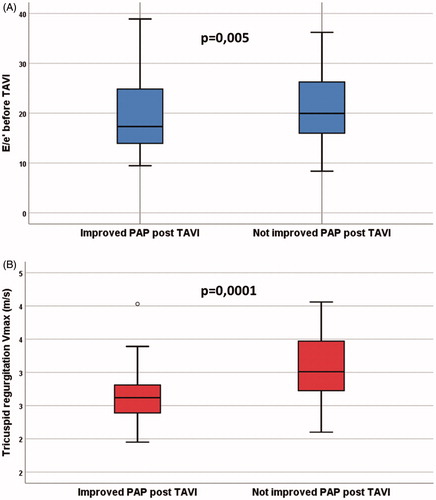
Table 4. Variation of clinical and echocardiographic variables after TAVI.
Figure 3. Correlation plot between the variation of the E/e′ ratio before and after the TAVI procedure (delta E/e′) and the variation of the pulmonary artery pressure (delta PAP) as derived from the maximal transtricuspid gradient. A correlation line was fitted to the data (central thick line), as well as 95% confidence intervals (thin lateral lines).
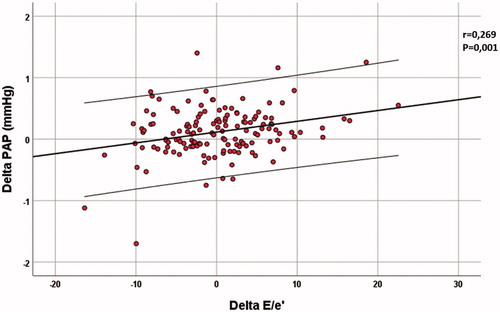
Table 5. Parameter variation as determinants of pulmonary artery pressure change 6 months after TAVI.

