

Figures & data
Figure 1. (A) Tracing the tricuspid regurgitation velocity-time integral; (B) analysis of speckle tracking echocardiography-derived right ventricular global longitudinal strain; (C) evaluation of the event timings of the tricuspid valve and pulmonic valve in the parasternal short-axis views; (D) measurement of right ventricular myocardial work by incorporating pulmonary pressures, right ventricular strain and cardiac cycle timings.
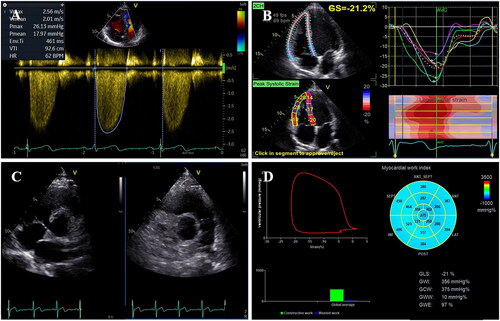
Table 1. Clinical and echocardiographic characteristics of the study population.
Table 2. Parameters of right ventricular myocardial work.
Figure 2. Individual values of right ventricular global work index (RVGWI), right ventricular global constructive work (RVGCW), right ventricular global wasted work (RVGWW) and right ventricular global work efficiency (RVGWE) according to sex and age categories. Horizontal lines represent median values or mean values. *p Value <.05 between sexes.
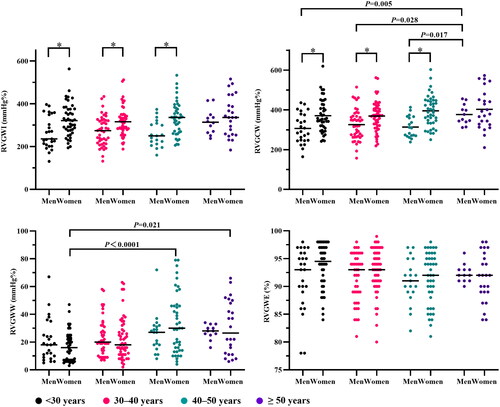
Table 3. Parameters of myocardial work and pulmonary artery pressure values according to sex and age.
Table 4. Univariable and multivariable analysis for RV myocardial work parameters.
Figure 3. The Bland–Altman analysis for assessing intra-observer variability of right ventricular global work index, right ventricular global constructive work, right ventricular global wasted work and right ventricular global work efficiency.
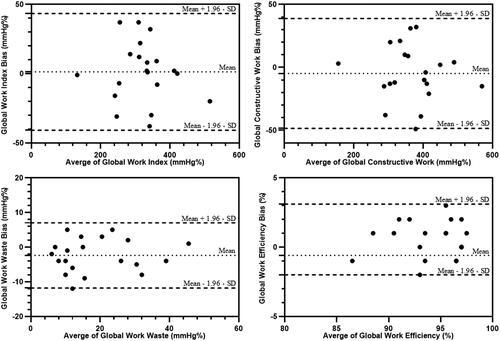
Figure 4. The Bland–Altman analysis for assessing inter-observer variability of right ventricular global work index, right ventricular global constructive work, right ventricular global wasted work and right ventricular global work efficiency.
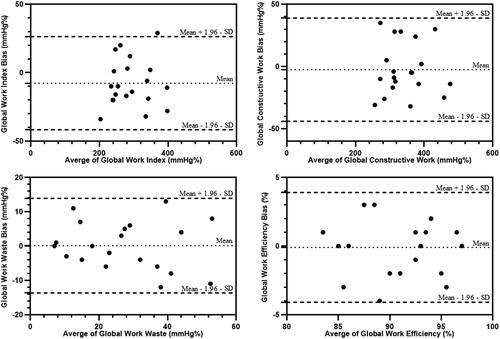
Table 5. Intra- and inter-observer variability of RV myocardial work indices.

