Figures & data
Table 1. Precision study of the AFIAS Tn-I plus assay.
Table 2. 99th percentile upper reference limit (URL) and confidence interval – overall apparently healthy population and subgroups.
Table 3. Precision at the 99th percentile upper reference limit (URL).
Figure 1. Absolute (A) and relative (B) difference plots when comparing the Abbott ALINITIY high Sensitive Troponin-I assay and the AFIAS Tn-I plus assay.
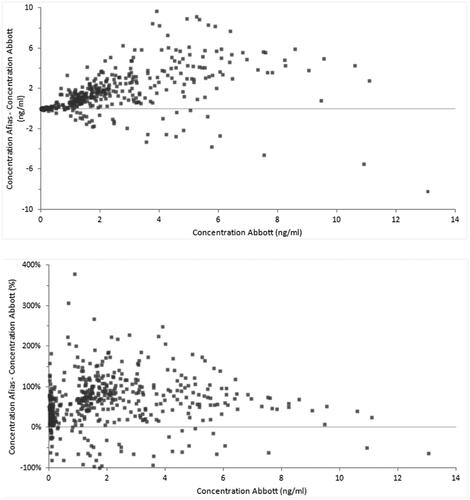
Figure 2. Passing Bablok regression analysis to compare AFIAS Tn-I Plus and Abbott ALINITY High Sensitive Troponin-I on 460 clinical samples with values ranging from 0.010 ng/ml to 15 ng/ml.
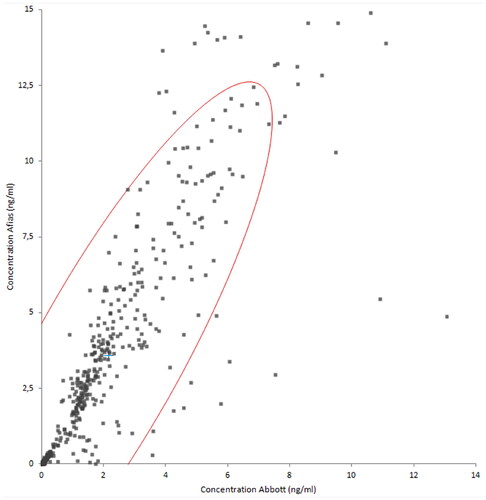
Figure 3. Pearson’s r correlation coefficient to compare AFIAS Tn-I Plus and Abbott ALINITY High Sensitive Troponin-I on 460 clinical samples with values ranging from 0.010 ng/ml to 15 ng/ml.
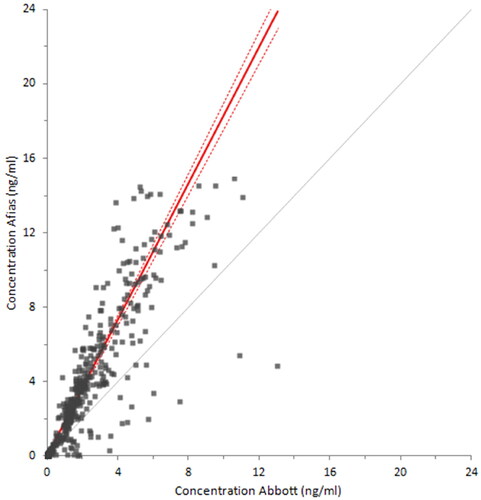
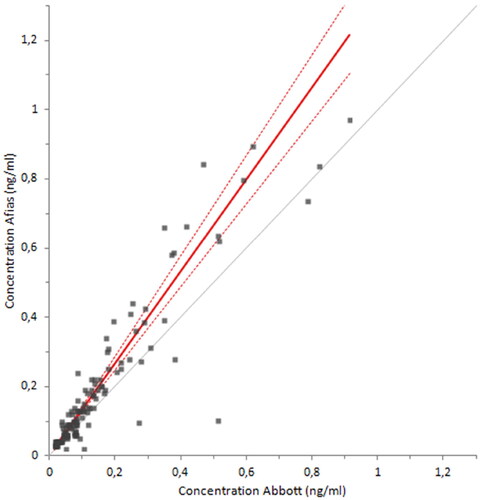
Figure 4. Passing Bablok regression analysis to compare AFIAS Tn-I Plus and Abbott ALINITY High Sensitive Troponin-I on 129 clinical samples with values ranging from 0.010 ng/ml to 0.1 ng/ml.
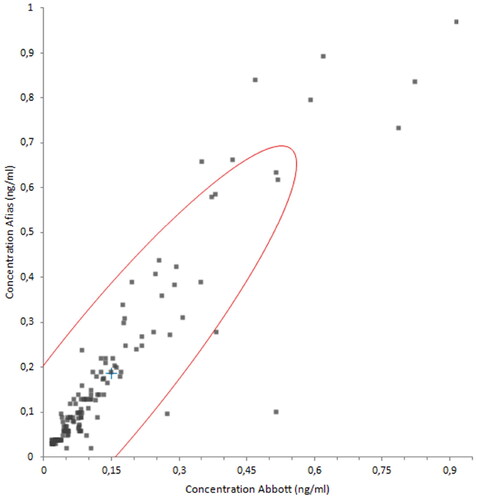
Figure 5. Pearson’s r correlation coefficient to compare AFIAS Tn-I Plus and Abbott ALINITY High Sensitive Troponin-I on 129 clinical samples with values ranging from 0.010 ng/ml to 0.1 ng/ml.