
Figures & data
Figure 1. Flow chart illustrating the intervention study; Period I: ‘Conventional care’ and Period II: ‘Intervention’ (DFCM-guided treatment).
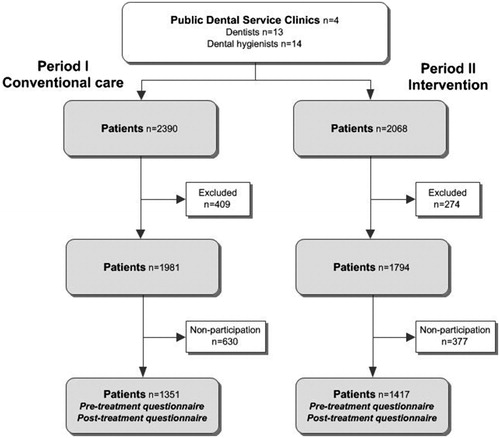
Table 1. Background data for patients participating in periods I and II: gender, dental fear according to DAQ and IDAF-4C+, reason for dental visit, and age.
Table 2. Patient-reported outcomes for discomfort, pain, tension, and patient satisfaction with dental health professionals (Patient Attitude Scale = PAS) in relation to periods I and II.
Table 3. Patient-reported discomfort, pain, tension, satisfaction with health professionals (Patient Attitude Scale = PAS) in relation to dental fear (DAQ, IDAF-4C+), gender, and cause of dental visit in periods I and II.