Figures & data
Figure 1. Number of antibiotic prescriptions per 1000 inhabitants and year in dentistry and the timepoint for implementation of strategies to optimize the usage.
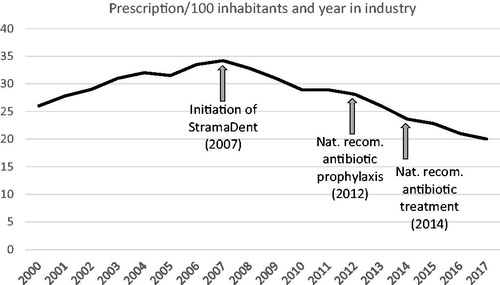
Figure 2. The total prescription of antibiotics in Swedish outpatient care and the fraction derived from dentistry.
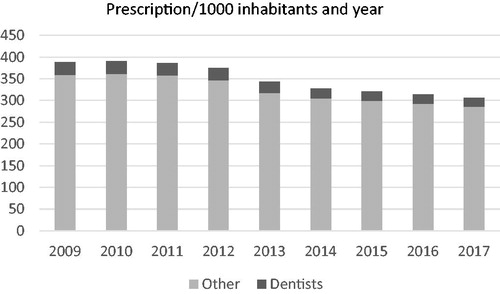
Figure 3. Number of antibiotic prescriptions in dentistry per 1000 inhabitants according to year and type of compound.
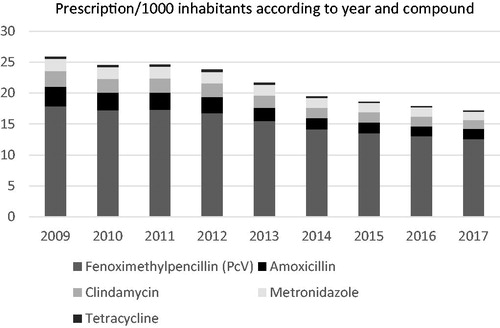
Figure 4. Number of antibiotic prescriptions in dentistry per 1000 inhabitants and per 1000 dental patients according to age group.
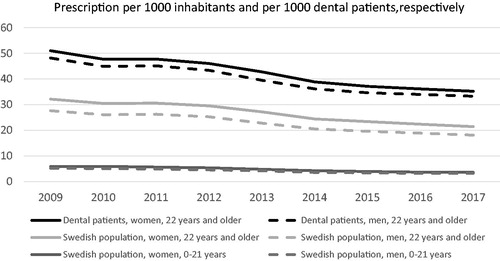
Figure 5. (A) Number of persons per 1000 inhabitants that received an antibiotic prescription from a dentist in 2009 in relation to gender. (B) Number of persons per 1000 inhabitants that received an antibiotic prescription from a dentist in 2017 in relation to gender. *** = p <.00001.
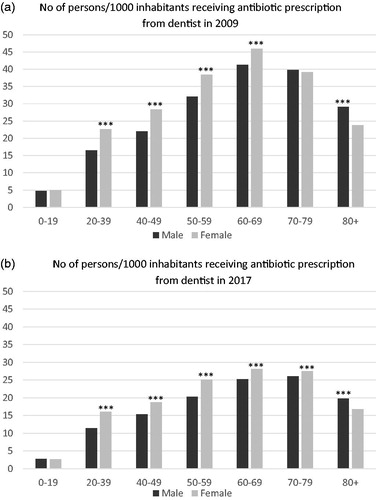
Figure 6. Number of persons, 22 years or older, per 1000 dental patients that received an antibiotic prescription during 2009 and 2017, respectively, using age standardized figures.
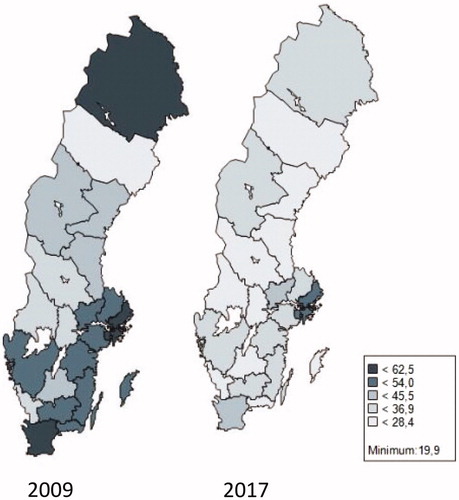
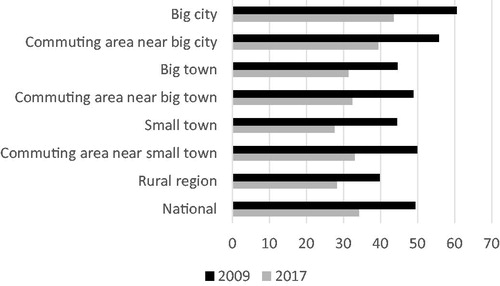
Figure 7. Number of persons receiving an antibiotic prescription per 1000 dental patients in relation to population density.