
Figures & data
Figure 1. Tumor dimensions were measured from axial (A) and coronal (B) T1-weighted fat-suppressed contrast-enhanced MR images. MR: magnetic resonance; cm: centimetre.
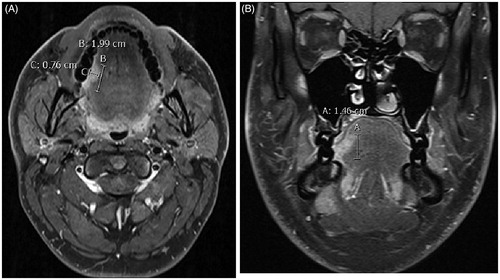
Figure 2. Coronal T1-weighted fat-suppressed contrast-enhanced MR image shows exophytic tumor growth (arrow). The exophytic part of the tumor was excluded when measuring the invasion depth. MR: magnetic resonance.
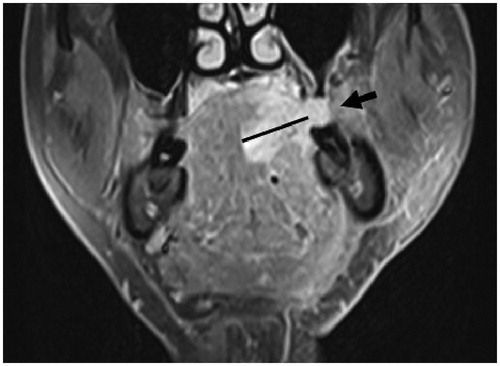
Figure 3. Axial T1-weighted, fat-suppressed contrast-enhanced MR images. (A) The presence of central necrosis in level II lymph node (arrow in A) was considered a definitive sign of malignancy. (B) A markedly enlarged and rounded level III lymph node (arrow in B). By size criteria, this node was considered malignant in OTSCC patient. MR: magnetic resonance; OTSCC: oral tongue squamous cell carcinoma.
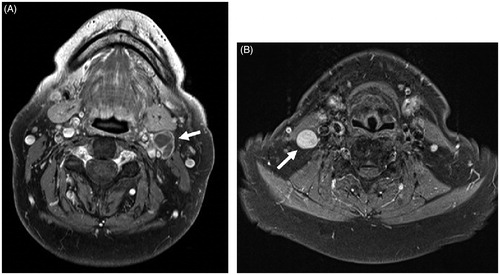
Figure 4. Maximum tumor (n = 45) diameter in MRI vs. histopathology. In two cases, the dimensions compared were the same, thus only 43 dots can be seen in the scatter plot. MRI: magnetic resonance imaging; mm: millimetre.
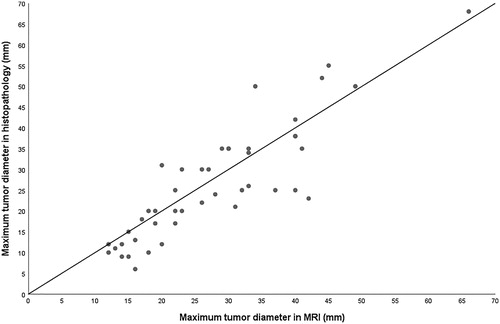
Figure 5. Tumor (n = 45) invasion depth in MRI vs. histopathology. In five cases, the dimensions compared were the same, thus only 40 dots can be seen in the scatter plot. MRI: magnetic resonance imaging; mm: millimetre.

Table 1. Comparison of rN and pN status (n = 43).