
Figures & data
Figure 1. Flow-chart of the case selection process.
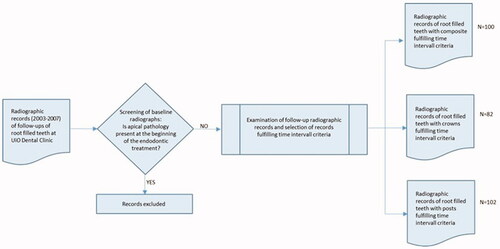
Figure 2. Two-state Markov model with a transition table showing disease progression from a healthy state (Model 1). Twenty-two teeth transited from healthy state into the diseased state and the rest remained disease free. Since the diseased state is an absorption state, transitions out of the disease state into the healthy state (recovery) are not possible.
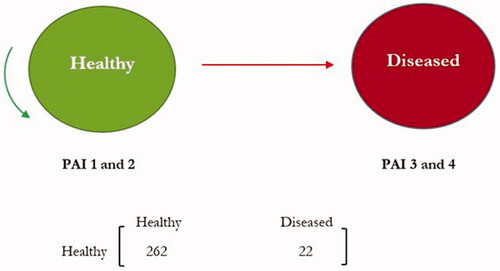
Figure 3. Three-state Markov model with a transition table showing disease progression from a healthy state and recovery from a mild state into a healthy state (Model 2). Twenty-one teeth were mildly diseased after one year, two were diseased and four recovered from the mild state.
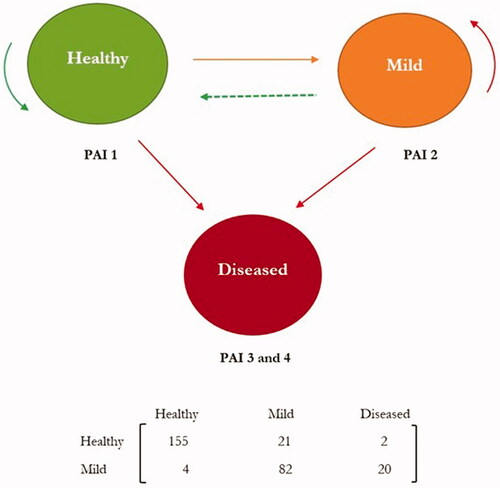
Table 1. Distribution of patient factors by treatment group in the study sample.
Table 2. Counts (%) of teeth that transited between disease states and estimates of transition probabilities in each treatment group based on Model 1.
Table 3. Counts (%) of teeth that transited between disease states and estimates of transition probabilities in each treatment group based on Model 2.
Table 4. Hazard ratios with 95 % confidence intervals of the association between covariates and outcomes from the univariate analysis of Model 1 and Model 2.
Table 5. Hazard ratios with 95 % confidence intervals of the association between covariates and outcomes from the multivariate analysis of Model 1 and Model 2.