
Figures & data
Figure 1. Participant flow diagram of children and adolescents with juvenile idiopathic arthritis (JIA) and controls.
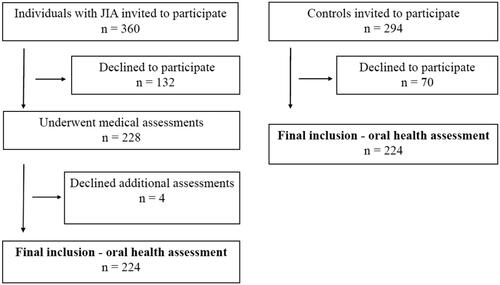
Table 1. Socio-behavioral, and subjective clinical characteristics of 162 individuals with juvenile idiopathic arthritis and 162 controls, aged 10–16 years.
Figure 2. Mean score of simplified Debris Index (DI-S), simplified Calculus Index (CI-S) and simplified Oral Hygiene Index (OHI-S) among individuals with juvenile idiopathic arthritis (JIA) and controls.
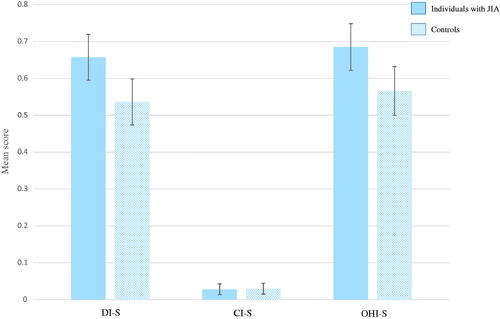
Figure 3. Mean percentage score of Gingival Bleeding Index (GBI) among individuals with juvenile idiopathic arthritis (JIA) and controls.
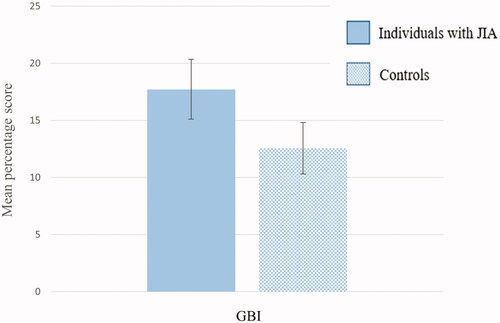
Table 2. Group affiliation, socio-behavioral, and clinical characteristics in relation to oral hygiene (OHI-S > 0), and gingival bleeding (GBI > 0). Unadjusted and adjusted mixed-effects logistic regression.
Figure 4. Percentage (95% confidence interval represented as error bars) of plaque or calculus (OHI-S > 0) at surface level among individuals with juvenile idiopathic arthritis (JIA) and controls.
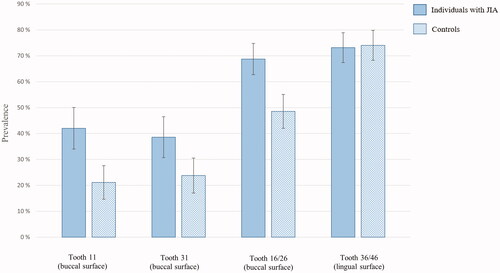
Figure 5. Percentage (95% confidence interval represented as error bars) of gingival bleeding (GBI > 0) at site level among individuals with juvenile idiopathic arthritis (JIA) and controls.
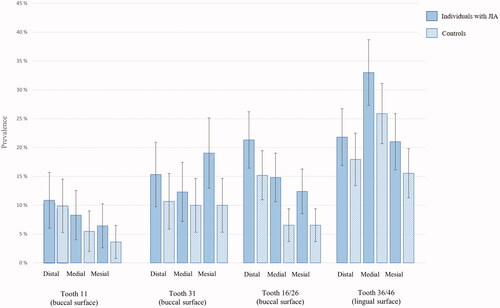
Table 3. Oral variables including side, jaw, and surfaces in relation to oral hygiene (OHI-S > 0), and side, jaw, surfaces, and sites in relation to gingival bleeding (GBI > 0) by group affiliation. Unadjusted mixed-effects logistic regression.
Table 4. Disease-specific features and oral variables in relation to oral hygiene (OHI-S > 0) and gingival bleeding (GBI > 0) among participants with juvenile idiopathic arthritis (JIA). Unadjusted and adjusted mixed-effects logistic regression.
Table 5. Other clinical characteristics of oral cavity among individuals with juvenile idiopathic arthritis (JIA) and controls ≥10 years.
Supplementary_information.docx
Download MS Word (53.1 KB)Data availability statement
The datasets used and/or analysed during the current study are available from the corresponding author on reasonable request.