
Figures & data
Figure 1. Mean DMFT in 20- to 60-year-old patients in Helsinki City PDS in 2012 (n = 39,820) and in 2017 (n = 43,392). Correlation between DMFT and age (r = 0.986) and year (r= −0.121).
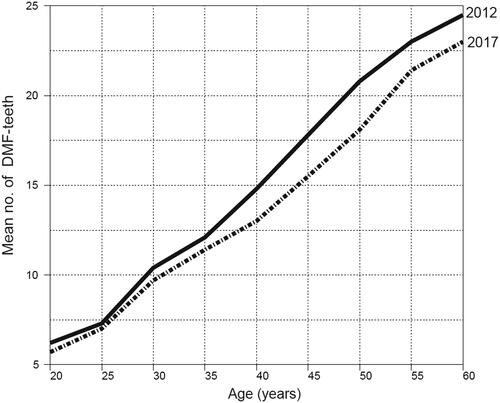
Table 1. Description (numbers and proportions) of restoration and enhanced prevention patients by 5-year age groups attending Helsinki City PDS in 2012 and 2017.
Table 2. Numbers of restorations, mean number of restorations per patient (Pts) and mean number of restorations per restoration patient (RePts) according to 5-year age groups at Helsinki City PDS in 2012 and 2017.
Figure 2. Distributions (%) of restorations performed on 20- to 60-year-old patients at Helsinki City PDS in 2012 (n = 86,845) (a) and in 2017 (n = 86,438) (b). Restorations classified by size (no. of surfaces filled). Minor repairs are combined with the one-surface category.
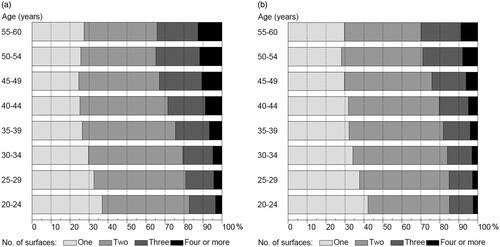
Table 3. Enhanced prevention measures provided for restoration patients (RePts) and pulp cappings made per 100 restored teeth (ReT) of Helsinki City PDS patients by 5-year age groups in 2012 and 2017.
Data availability statement
The data that support the findings of this study are available from The City of Helsinki Department of Social Services and Healthcare. Restrictions apply to the availability of these data, which were used under licence for this study. Such dataset may be requested from The City of Helsinki Department of Social Services and Healthcare.