
Figures & data
Table 1. Demographic data. Number of individuals from 24 years and above in three age categories treated with the insertion of at least one dental implant during the study period 2009–2019. Data collected from the Swedish Dental Health Register (SDHR) where all dental procedures are coded which connect the diagnosis and/or type of treatment to the economical subsidising system.
Table 2. Number of treatment procedures among individuals from 24 years of age and above in different age categories during the study period 2009–2019 according to Swedish Dental Health Register (SDHR). Data from each treatment category; insertion of a single implant (SI), insertion of 2–3 implants (2–3), insertion of ≥4 implants is presented.
Figure 1. Proportion (%) of implant surgical treatment visits when an antibiotic prescription was despatched by the treating dentist registered in the Swedish Dental Health Register (SDHR) and the Swedish Prescribed Drug Register (SPDR) during the study period 2009–2019 in three different age categories. Source: the Swedish Dental Health Register and the Swedish Prescribed Drug Register.
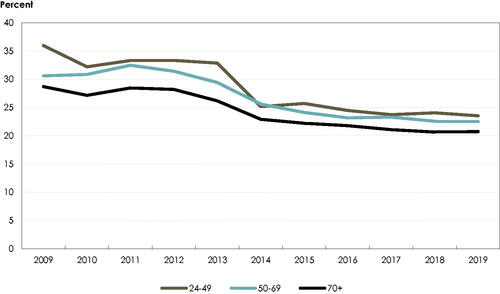
Table 3. Proportional (%) reduction in each year of the study period 2009–2019 of antibiotic prescriptions dispatched at visits to dental clinics when surgical implant treatment was performed. Individuals divided into six age categories to clearly illustrate change in older age (70–79 and 80+).
Figure 2. Proportion (%) of implant surgical treatment visits when an antibiotic prescription was despatched by the treating dentist in different age groups divided into the two major care givers in Sweden: Public dental clinics and Private dental clinics.
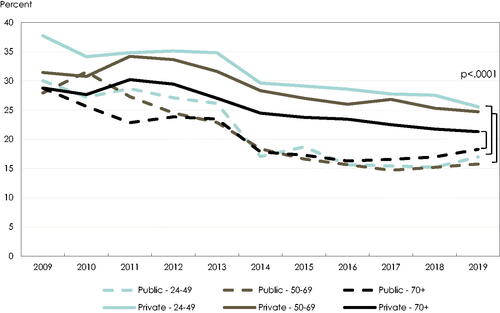
Figure 3. Proportion (%) of implant surgical treatment visits when an antibiotic prescription was despatched by the treating dentist among individuals in the age group 50–69 years of age divided into four educational levels (compulsory/upper secondary/post-secondary <3 years, post-secondary >3 years).
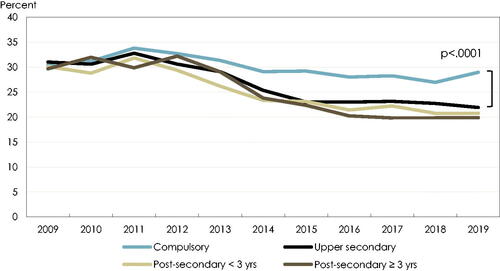
Figure 4. Proportion (%) of implant surgical treatment visits when an antibiotic prescription was despatched by the treating dentist. Individuals divided according to residence in relation to regional urbanization (in big city, in city town, in small town, and in rural area).
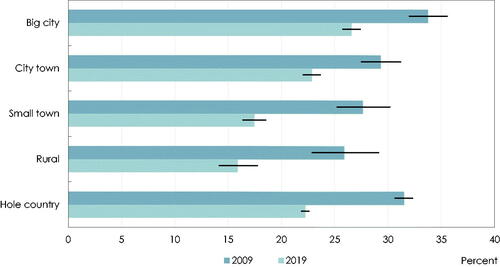
Figure 5. Proportion (%) of implant surgical treatment visits when an antibiotic prescription was despatched by the treating dentist. Distribution of different antibiotic compounds during the study period 2009–2019 (data age standardized).
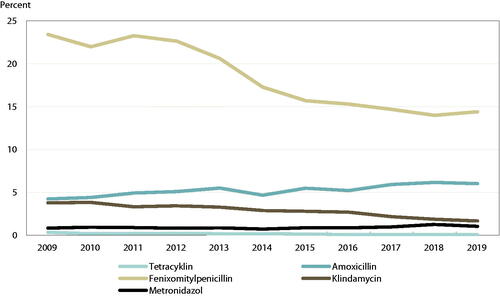
Table 4. Proportional distribution of prescriptions of antibiotic compounds per 1000 dental visits (n) in conjunction with implant surgical procedures (age-standardized data).