
Figures & data
Table 1. Basic characteristics of 165 patients with substance use disorders (numbers (n) and percentages (%).
Figure 1. (a + b) Pen’s parade figure presenting distribution of Oral Impact on daily performance sum score (0: not affected to 32: extremely affected) ordered from lowest to highest (a). Correspondingly, EQ-5D-5L index value (0: dead to 1: perfect health) at baseline is presented (b) with lines indicating change to value at second measuring point (∼1 year later). *The green dashed line represents the mean index value of our study sample (0.690) at baseline and the blacked dashed line represents the mean value of the general Norwegian population (0.848).
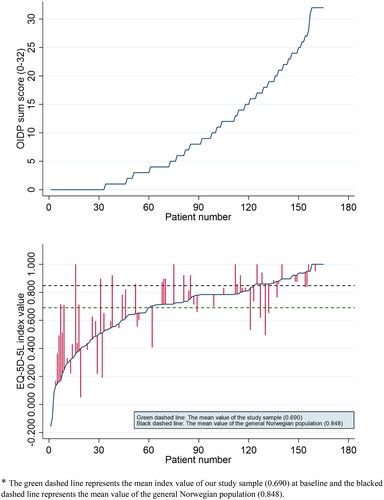
Figure 2. (a) Percentage distribution of eight OIDP dimensions among 165 patients with substance use disorder. (b) Percentage distribution of five EQ-5D-5L dimensions among 165 patients with substance use disorder.
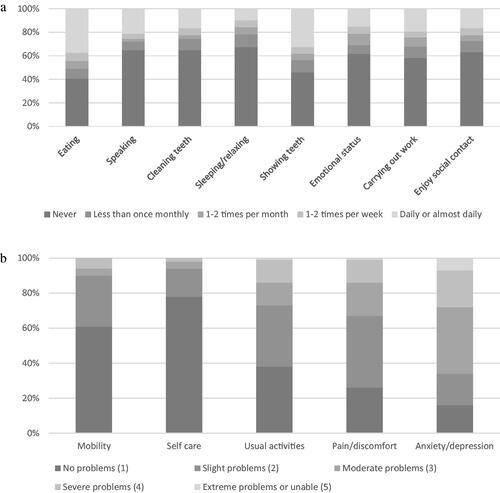
Table 2. Spearman’s correlations, rs, between each EQ-5D-5L of five dimensions (5 levels) and OIDP eight items (5 levels) among 165 patients with substance use disorder.
Table 3. Linear regression of the association between EQ-5D-5L sum score (5–20) and OIDP sum score (0–32) at baseline, sex, and age (n = 165).
Table 4. Linear regression of the association between EQ-5D-5-L index value (0-1) and OIDP (scaled 0-1) at baseline, sex, and age.
Supplemental Material
Download MS Word (17.7 KB)Data availability statement
Data upon which this study is based is available from the authors upon request.