
Figures & data
Table 1. Characteristics of the children and their parents.
Table 2. Hair cortisol concentration, insomnia symptoms, health-related quality of life and oral health-related quality of life in the two groups.
Figure 1. Multiple line chart of the mean number of decayed, extracted and filled tooth surfaces (defs), Family Impact Scale (FIS) and Parental-Caregivers Perception Questionnaire (P-CPQ) related to sleep duration, n = 39.
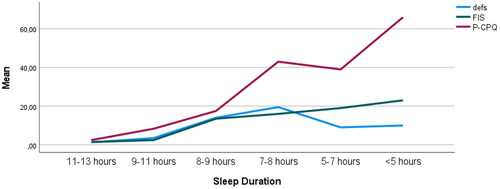
Figure 2. Multiple line chart of the mean number of decayed, extracted and filled tooth surfaces (defs), Family Impact Scale (FIS) and Parental-Caregivers Perception Questionnaire (P-CPQ) related to sleep maintenance problems (SMP), n = 39.
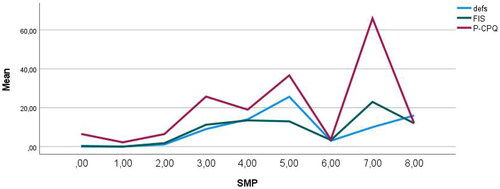
Table 3. Correlationsa between oral health and insomnia symptoms, n = 39.
Data availability statement
The datasets used and analyzed during the current study are available from the corresponding author on reasonable request.