Figures & data
Table 1. Demographic data and results of patients with osteonecrosis and arthrosis of the hip
Figure 1. The uncemented total hip replacement device with a straight, collarless stem made of a titanium-alu-minium-vanadium alloy (Ti-6Al-4Va), with an additional coating of hydroxyapatite in the proximal two-thirds, which was combined with spherical press-fit cup (Ti-6Al-4Va), a polyethylene liner and a ceramic head.
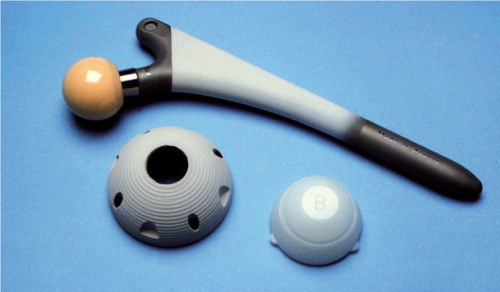
Table 2. Radiographical evaluation including femoral bone radiolucency, atrophy, hypertrophy and osteolysis in the seven Gruen zones
Table 3. Radiographical evaluation of the acetabular component including radiolucency, atrophy, and osteolysis in the DeLee and Charnley zones
Figure 2. Kaplan-Meier life-table analysis with stem revision (for any reason) as the endpoint. Bold line: survival curve. Thin lines: 95% confidence limits. In the osteonecrosis group, the survival rate of the femoral component was 74% (95% CI: 55–34). The median follow-up time for the patients was 6.1 (2–11) years.
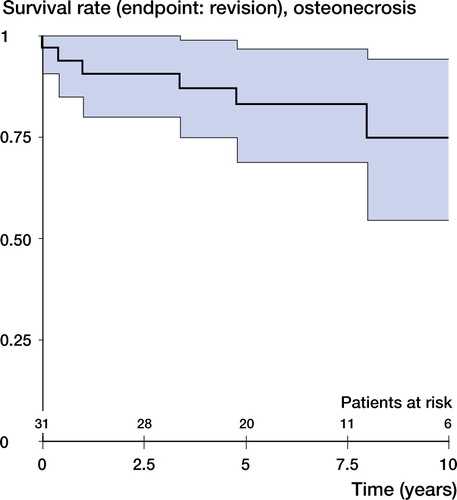
Figure 3. Kaplan-Meier life-table analysis with mechanical failure as the endpoint. Bold line: survival curve. Thin lines: 95% confidence limits. In the osteonecrosis group, the survival rate of the femoral component was 54% (CI: 31–76). The median follow-up time for the patients was 6.1 (2–11) years.
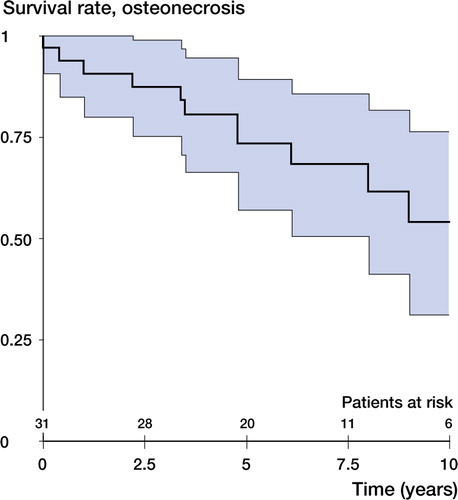
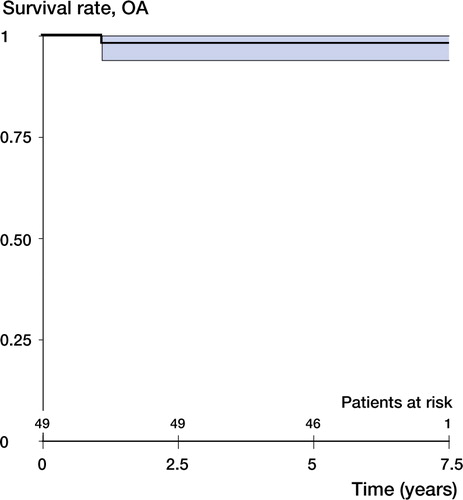
Figure 4. Kaplan-Meier life-table analysis with stem revision for any cause as the endpoint. Bold line: survival curve. Thin lines: 95% confidence limits. In the osteoarthrosis group, the survival rate of the femoral component was 98% (CI: 94–100). The median follow-up time for the patients was 5.9 (4–8) years.